
Weekly Bitcoin Price Analysis & Forecasts the 29th June - 5th July 2026
Following on from last week’s pressure around the $58,000 to $60,000 support zone, Bitcoin showed an encouraging short-term recovery during the week of 29th June to 5th July 2026.
BTC spent the early part of the week building a base around the high-$58,000 and low-$59,000 region before buyers stepped in with stronger momentum. This allowed price to reclaim both the hourly 50 EMA and 200 EMA, pushing Bitcoin back toward the $63,000 to $64,000 range.
The recovery is constructive, particularly after the recent sell-off, but the broader daily structure remains cautious. Bitcoin is still trading below the daily 50 EMA and well below the daily 200 EMA, meaning this move should currently be viewed as a recovery attempt rather than confirmation that the wider bearish trend has fully reversed.
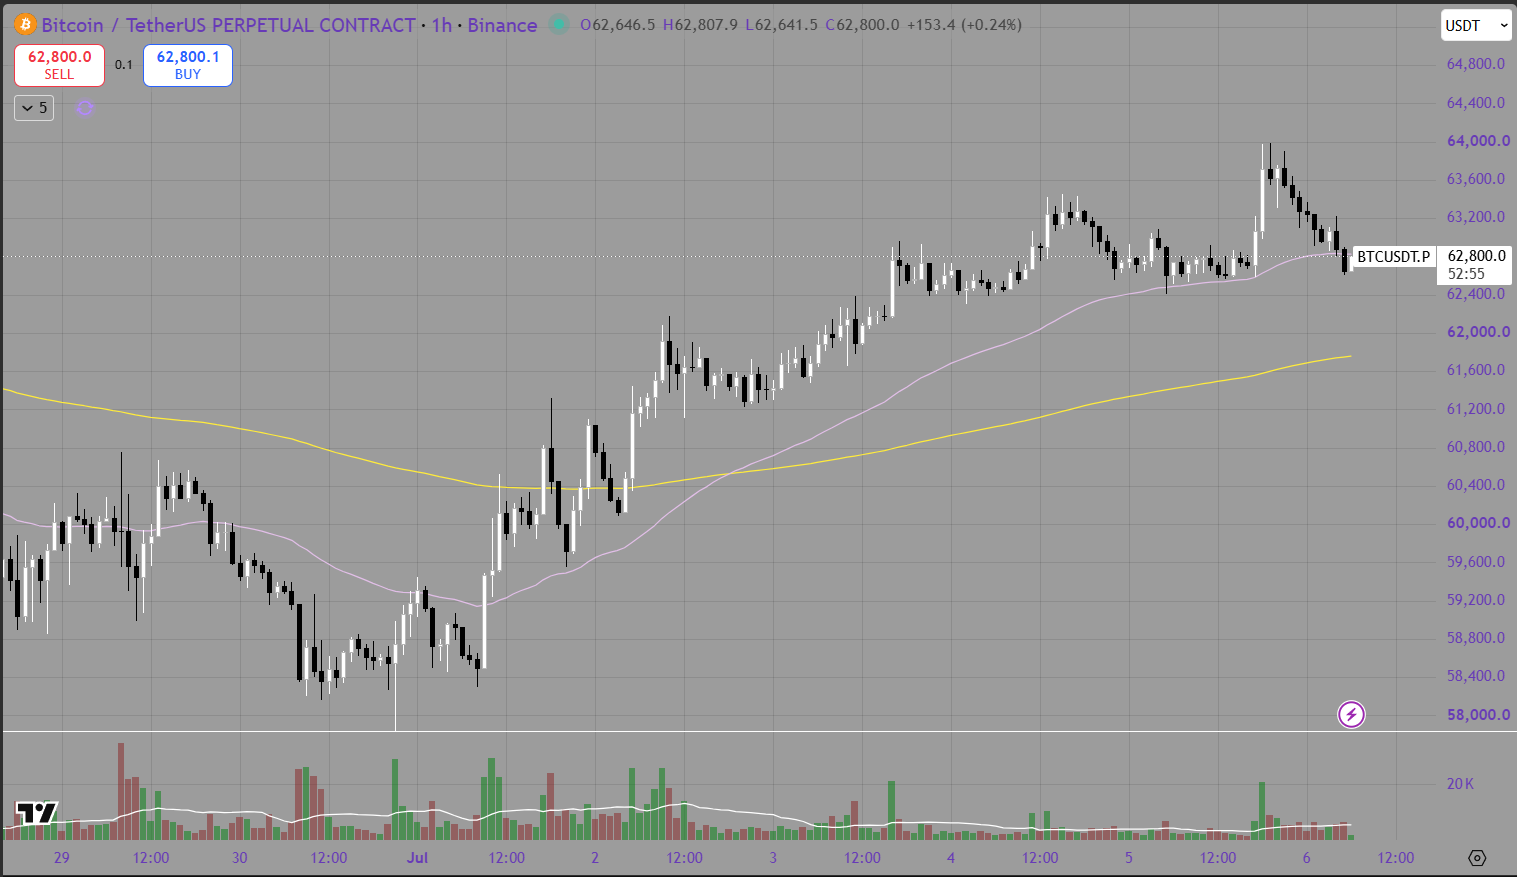
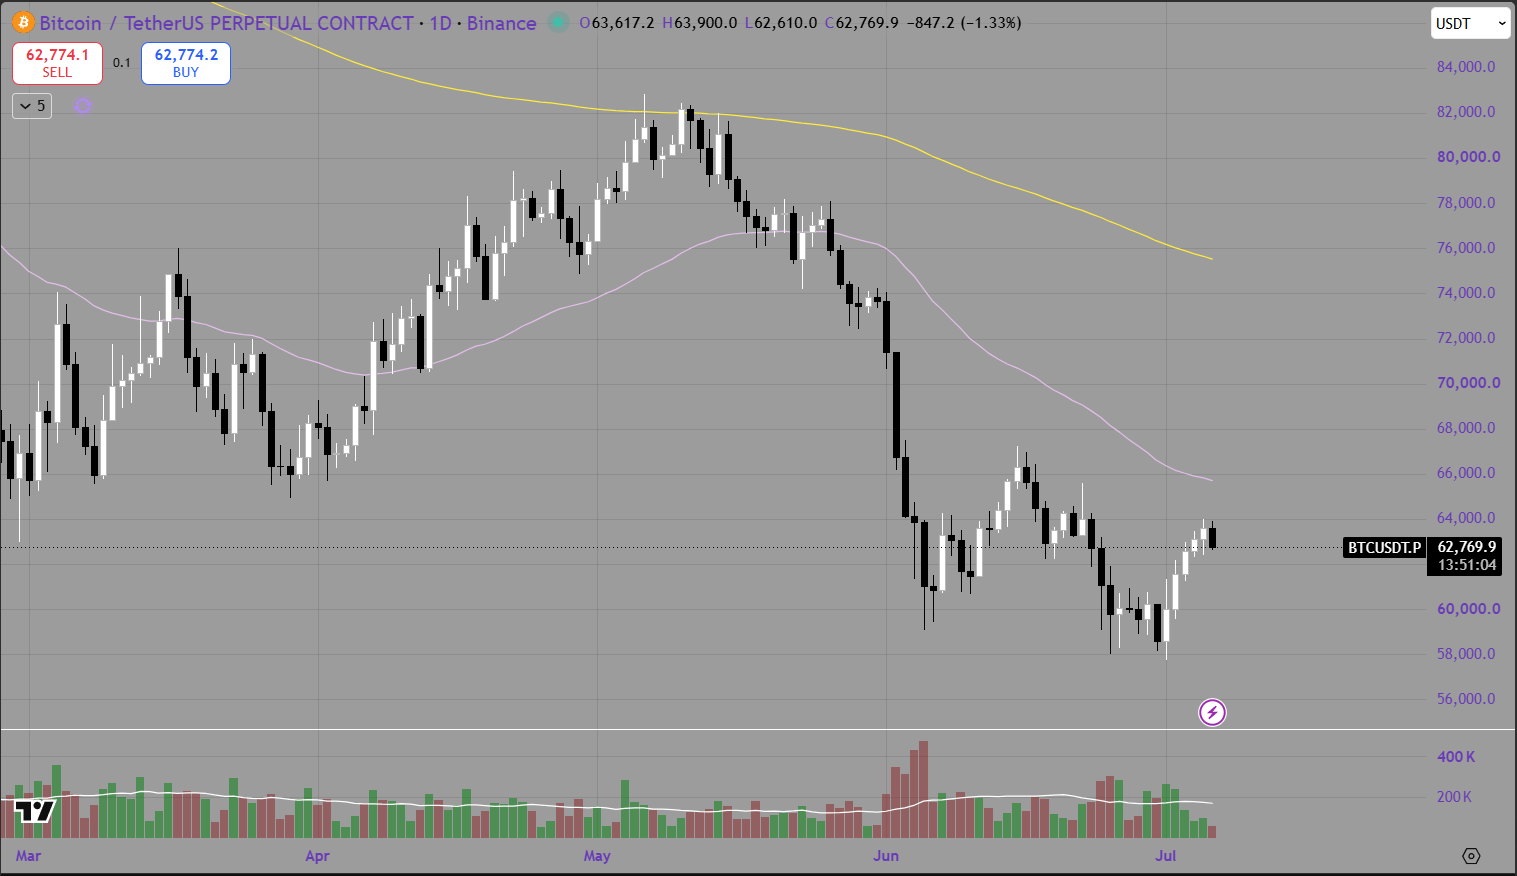
The purple line represents the 50 EMA, while the yellow line represents the 200 EMA.
Hourly Analysis (1H)
The hourly chart shows a clear improvement in short-term momentum over the past week.
Bitcoin began the period under pressure, trading near the $59,000 area after failing to hold higher levels during the previous week. Price initially remained choppy, with sellers still controlling the market below the hourly moving averages.
However, BTC found support around the $58,500 to $59,000 zone. This area became an important base, with buyers stepping in repeatedly and preventing a deeper breakdown toward the lower-$58,000 region.
The market then began to form higher lows. Bitcoin reclaimed the purple 50 EMA first, which was an early signal that short-term selling pressure was easing. From there, BTC pushed through the yellow 200 EMA around the $60,000 to $60,500 area, confirming a stronger shift in hourly structure.
The move above both moving averages led to a steady rally through $61,000 and $62,000, before Bitcoin pushed into the $63,500 to $64,000 region. The breakout was supported by stronger buying activity, particularly during the initial move above the 200 EMA.
At the time of writing, BTC is consolidating around $62,800 after rejecting slightly from the $63,800 to $64,000 area. This does not necessarily invalidate the recovery. Some consolidation after such a move is healthy, especially after Bitcoin had been trading under sustained pressure.
The key short-term support now sits around $62,400 to $62,600, near the rising hourly 50 EMA. Holding above this zone would keep the immediate recovery structure intact.
Below that, the $61,600 to $62,000 region is more important, as this contains the hourly 200 EMA and the breakout area. If Bitcoin loses that level, the market could return to a more neutral or bearish short-term structure.
On the upside, the first resistance area sits around $63,800 to $64,000. A clean break and hold above this zone could open the door for a move toward $64,500, followed by the psychological $65,000 level.
Daily Analysis (1D)
The daily chart remains more cautious than the hourly chart, despite Bitcoin’s improved short-term price action.
BTC is recovering from the sharp decline that pushed price from the low-$80,000 region into the high-$50,000s during June. The recent bounce back toward $63,000 is positive, but it has not yet repaired the broader damage caused by the breakdown.
The purple daily 50 EMA remains well above current price, sitting around the mid-$60,000 region. This makes the $65,000 to $67,000 area the first major daily resistance zone. Bitcoin will need to reclaim this region and begin closing above it consistently before the broader recovery can be considered more convincing.
The yellow daily 200 EMA remains significantly higher, around the mid-to-high-$70,000 region. This reinforces that the longer-term trend is still not bullish. Until BTC can reclaim both the daily 50 EMA and 200 EMA, rallies should be treated with caution.
The most encouraging aspect of the daily chart is that Bitcoin has once again defended the lower-$60,000 region. The $58,000 to $60,000 zone has now acted as an important demand area, with buyers responding after the recent sell-off.
For the daily structure to continue improving, Bitcoin needs to hold above $60,000 and build a higher low above the June lows. A sustained move above $64,000 would be the first meaningful step, while a move above $65,000 to $67,000 would suggest that buyers are beginning to regain stronger control.
The main downside risk remains a loss of the $60,000 area. If BTC breaks and closes below this zone again, it could place the recent lows around $58,000 back into focus. A clean break below $58,000 would weaken the structure further and could trigger another deeper move lower.
Summary
Bitcoin showed encouraging short-term recovery momentum during the week, bouncing from the high-$58,000 region and reclaiming both the hourly 50 EMA and 200 EMA.
The hourly chart has improved significantly, with BTC now consolidating near $62,800 after reaching the $63,800 to $64,000 resistance zone. As long as Bitcoin holds above the $62,400 to $62,600 area, the short-term recovery remains intact.
The daily chart is still more cautious. Bitcoin remains below the daily 50 EMA and 200 EMA, meaning the broader trend has not yet fully reversed. The $58,000 to $60,000 area remains the major support zone, while the $65,000 to $67,000 region is the key daily resistance area that buyers need to reclaim.
Key levels to monitor this week include:
Immediate resistance: $63,800 to $64,000
Higher resistance: $64,500 to $65,000
Major daily resistance: $65,000 to $67,000
Initial support: $62,400 to $62,600
Key hourly support: $61,600 to $62,000
Major daily support: $58,000 to $60,000
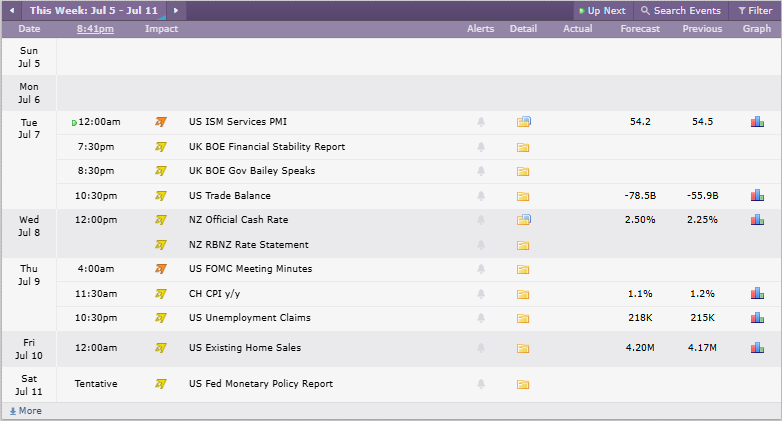
Looking ahead, the Crypto Craft calendar does not show any red-folder events for the upcoming week.
Credit: Crypto Craft
That said, there are still several events that could create some volatility across broader markets, including US ISM Services PMI, US FOMC Meeting Minutes, Chinese CPI data and US unemployment claims. While these are not marked as the highest-impact events in the calendar, traders should still remain cautious around any Federal Reserve commentary or data that changes expectations around inflation, interest rates or bond yields.
For now, Bitcoin is showing the first signs of a more constructive recovery. The key confirmation will be whether BTC can hold above its reclaimed hourly moving averages and break decisively through $64,000. A move above that level would strengthen the bullish case, while a fall back below $61,600 would suggest that the recovery remains fragile.
