
Bitcoin’s recovery attempt faded during 19–25 October, with a rally toward $84,800 giving way to renewed selling and another test below $80,000. Buyers responded around the low $79,000s, but the market finished the period with a weaker structure and several resistance levels overhead.
The coming week centres on whether Bitcoin can establish support around $79,200–$80,000 and reclaim the low $81,000s. With the Federal Reserve’s decision approaching, European protests continuing and conflict threatening energy supplies, both technical levels and macroeconomic developments could shape the next move.
Hourly Analysis
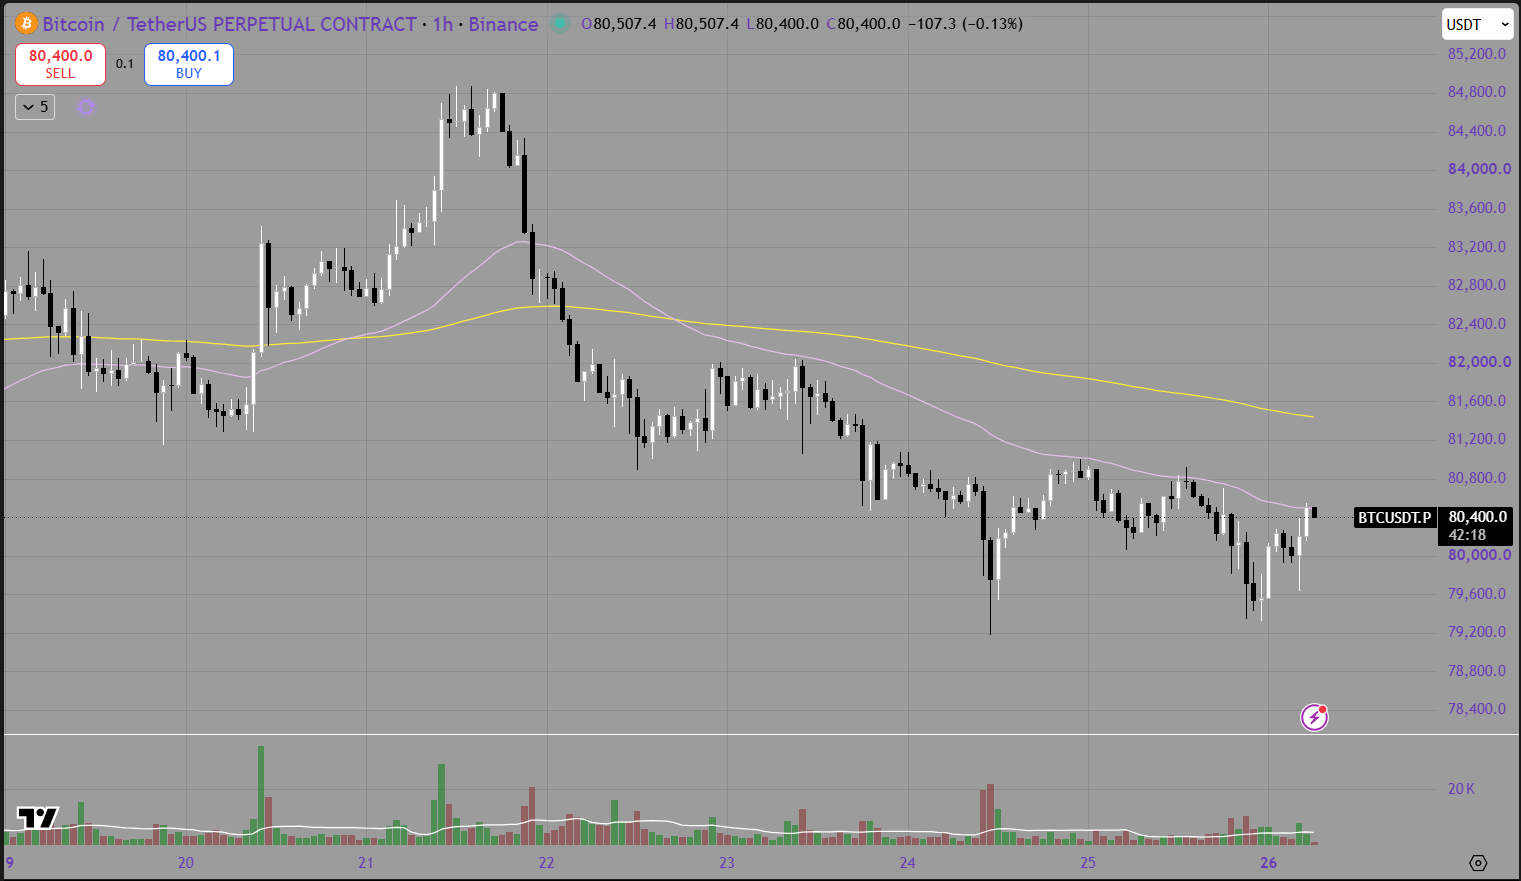
Bitcoin began last week trading around $82,000–$83,000 before slipping toward $81,400. Buyers regained control on 20 October, pushing price above both hourly moving averages and building momentum into the following day.
The recovery accelerated on 21 October, reaching approximately $84,800. However, repeated attempts near the high failed to produce further upside. A sharp reversal then carried Bitcoin below the shorter-term moving average, followed by the longer-term average as selling continued into 22 October.
That reversal was the defining move of the week. The breakout initially appeared constructive, but its failure left a lower high on the broader chart and returned control to sellers.
Bitcoin subsequently formed a sequence of lower highs and lower lows. Attempts to recover toward $82,000 on 22–23 October stalled, while both hourly moving averages turned lower. By 24 October, another sell-off briefly pushed price toward $79,200 before buyers lifted it back above $80,000.
The weekend recovery struggled around $80,800–$81,000. A further dip late on 25 October again tested the low $79,000s, followed by a bounce. The supplied chart extends into 26 October and shows Bitcoin near $80,400, testing the shorter-term moving average while remaining below the longer-term average.
For the coming week, $80,600–$81,000 is the first resistance zone. A sustained reclaim would improve the immediate structure, but buyers would still need to overcome $81,400–$82,000, where the declining longer-term average and earlier trading activity provide additional resistance.
On the downside, $80,000 remains the immediate psychological reference, followed by $79,200–$79,600. Repeated buying in that lower zone is encouraging, but a confirmed reversal requires a break of the intervening highs. Until then, the rebounds remain vulnerable to renewed selling.
Daily Analysis
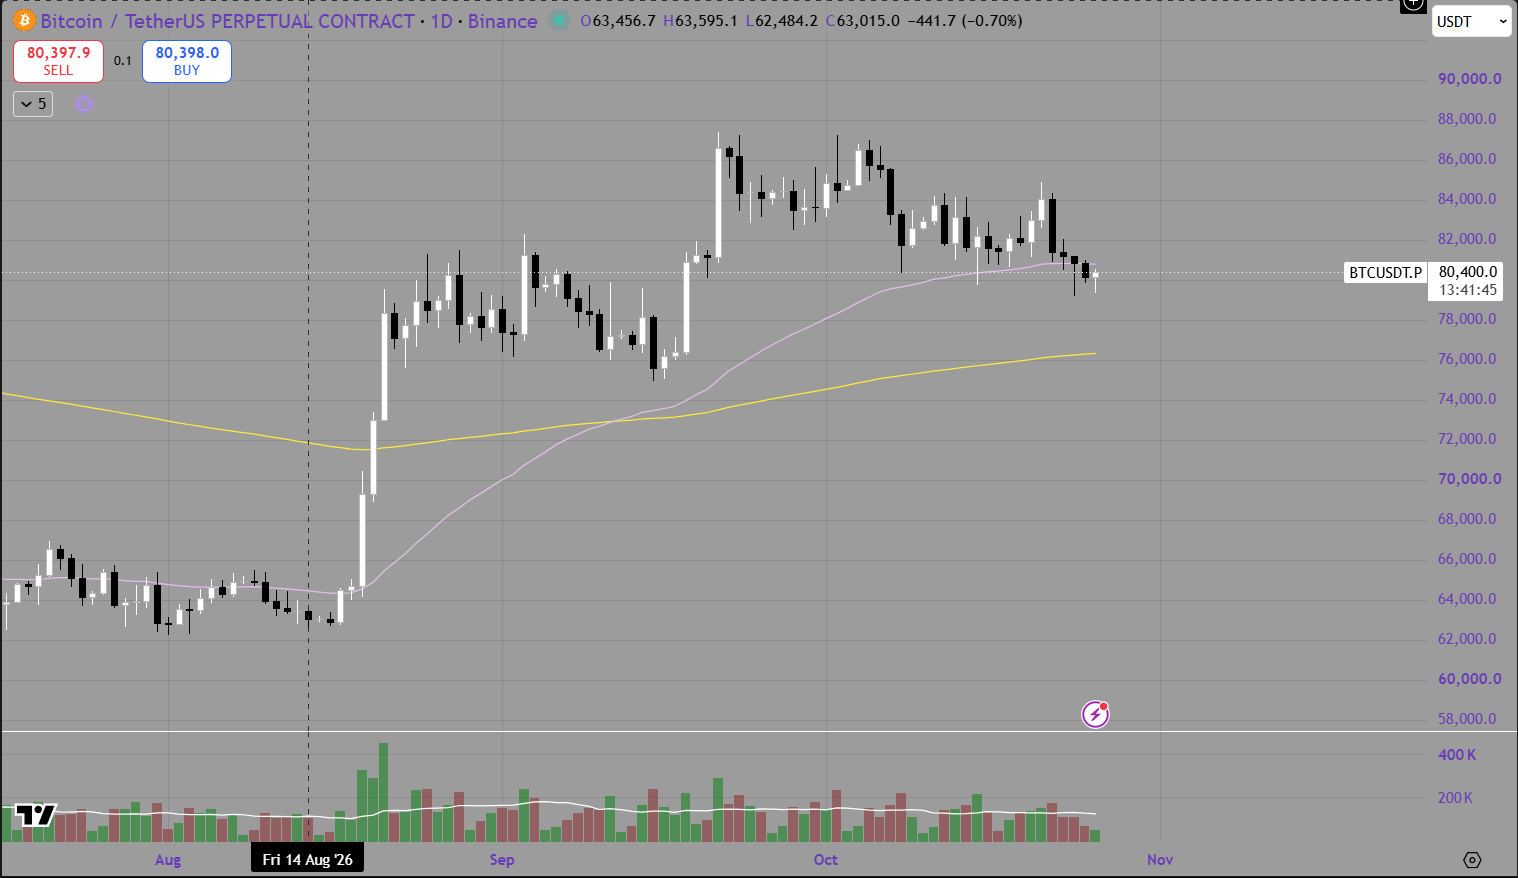
The daily chart shows the correction from the September and early-October highs continuing. Last week’s rally toward $84,800 failed below the earlier peaks around $86,000–$87,500, reinforcing the sequence of lower highs.
Price has also slipped beneath the shorter-term daily moving average, which now sits around the upper $80,000s to low $81,000s. That marks a deterioration from the previous week, when this average was still providing support. Its role now becomes a test: can Bitcoin reclaim it, or will it begin acting as resistance?
The longer-term daily moving average remains below price, near $76,000–$76,500, and continues to slope upward. This leaves the broader advance from August partly intact, although the shorter-term daily structure favours caution.
The bullish scenario begins with Bitcoin defending the recent lows and reclaiming $81,000–$82,000. Holding that area on a subsequent pullback would strengthen the case for a recovery toward $83,200–$83,600, followed by last week’s $84,400–$84,800 rejection zone.
A daily close above $84,800 would meaningfully weaken the recent lower-high structure. Until that happens, a rebound can still develop within the existing correction.
The bearish scenario requires a decisive break below $79,200, followed by a failed attempt to reclaim it. That would expose the earlier trading region around $78,000, with $76,000–$77,000 becoming relevant if selling extends toward the longer-term daily average.
These are conditional pathways. The reaction at support and resistance will matter more than assuming either outcome in advance.
Summary
Last week’s rally failed to hold, leaving Bitcoin near $80,000 with declining hourly moving averages and a weaker daily structure. Buyers have defended the low $79,000s, but reclaiming $81,000–$82,000 is the first meaningful step toward improving the outlook.
The economic backdrop remains sensitive to energy prices and investor confidence. Global equities entered this week after a decline in the previous week, while oil remained elevated despite easing on Monday. That combination keeps attention on inflation pressures and the outlook for borrowing costs.
European protests remain a source of political uncertainty. French unions and protest groups have called for further demonstrations on 31 October, following nationwide rallies over wages, living costs and public services. Reuters also reported unrest in Belgium, Albania and Italy. These developments add to concerns about household purchasing power and governments’ ability to respond.
Conflict-related energy risks are also unresolved. Houthi attacks in Saudi Arabia helped drive oil higher last week, while diplomatic efforts involving Qatar and Iran contributed to Monday’s pullback. The outlook therefore includes both escalation risk and the possibility of de-escalation.
For Bitcoin, the potential connection is through inflation expectations, interest rates and demand for risk assets. Further energy disruption could complicate the outlook for monetary easing, while credible diplomatic progress could relieve some pressure. These are possible transmission channels, rather than proof that any single headline caused Bitcoin’s decline.
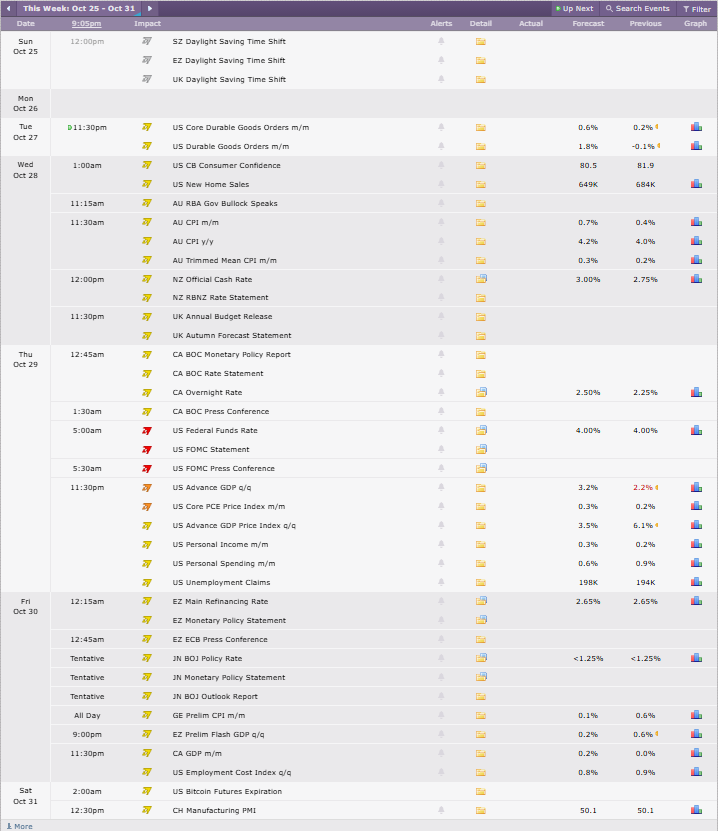
The supplied Crypto Craft calendar covers 25–31 October. Its red-impact events are concentrated on the Federal Reserve announcement, with the following times shown in Sydney time, AEDT:
Thursday, 29 October, 5:00 am: US Federal Funds Rate.
Thursday, 29 October, 5:00 am: FOMC Statement.
Thursday, 29 October, 5:30 am: FOMC Press Conference.
The Federal Reserve’s October meeting is scheduled for 27–28 October in the United States, corresponding to the early hours of 29 October in Sydney. The supplied calendar forecasts an unchanged headline rate of 4.00%. Guidance on inflation and the future policy path could therefore matter as much as the decision itself.
Credit: Crypto Craft
The market map for 26 October–1 November is:
Bullish scenario: Defend $79,200–$80,000, reclaim $81,000–$82,000 and hold a higher low. That would improve the recovery case toward $83,200–$83,600 and potentially $84,800.
Consolidation scenario: Continue trading between approximately $79,200 and $81,000 while awaiting a clearer catalyst.
Bearish scenario: Break below $79,200 and fail to reclaim it, increasing the risk of a move toward $78,000 and, if weakness persists, $76,000–$77,000.
The key confirmation will be whether Bitcoin can hold above reclaimed resistance after the Federal Reserve announcement. A brief spike higher would carry less weight than sustained buying that interrupts the current sequence of lower highs.
