
Bitcoin Weekly Market Map: 19–25 October 2026
Bitcoin faced renewed selling pressure during 12–18 October, falling from above $84,000 to briefly below $80,000 before recovering. Buyers defended the lower end of the range, but the rebound has yet to reverse the broader sequence of lower highs established since early October.
The coming week presents an important test: can Bitcoin hold its recovery above $82,000 and reclaim overhead resistance, or will another rejection bring $80,000 back into focus? European unrest, persistent inflation concerns and escalating conflict around energy infrastructure add uncertainty to that technical setup.
Hourly Analysis
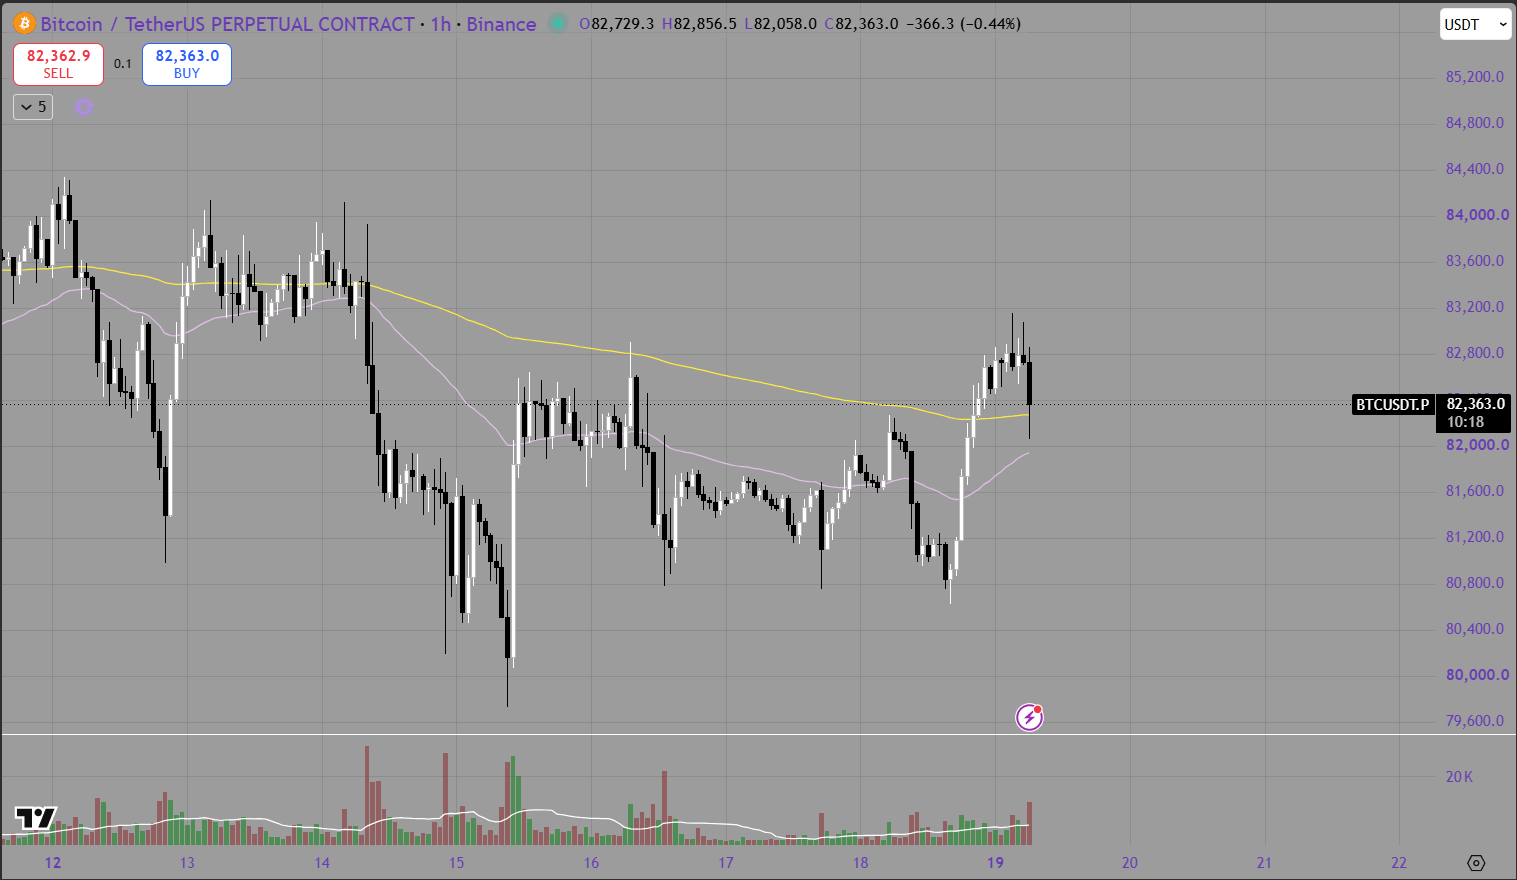
Bitcoin opened last week trading around $83,500–$84,000 before selling on 12 October pushed price toward $81,000. Buyers responded quickly, but the recovery struggled to sustain a move above $84,000. Trading on 13 October remained unsettled, with price repeatedly crossing the moving averages.
The decisive deterioration arrived on 14 October. Bitcoin broke below the mid-$83,000s and both hourly moving averages, accelerating toward $81,500. Further selling on 15 October briefly carried price below $80,000, producing the week’s clearest downside extension.
Volume increased around these declines and the subsequent rebound, showing that the low attracted considerable trading activity. The response was strong enough to recover $82,000, although follow-through stalled around $82,500–$82,800. That left the market vulnerable to another pullback on 16 October.
Over the weekend, Bitcoin largely traded between approximately $80,800 and $82,200. A late recovery on 18 October extended into the opening of 19 October, lifting price above both hourly moving averages and toward $83,000. The latest snapshot shows a rejection from approximately $83,100, with Bitcoin back near $82,400.
For buyers, the immediate task is to defend $82,000–$82,200 and turn the reclaimed moving-average area into support. A sustained move above $82,800–$83,200 would strengthen the recovery and bring $83,600–$84,200 into view.
If Bitcoin loses $82,000 again, the recovery becomes less convincing. Support around $81,200–$81,600 would then come into focus, followed by $80,800 and the recent $79,700–$80,000 low.
The hourly rebound is encouraging, but confirmation requires price to hold a higher low and break the latest resistance zone.
Daily Analysis
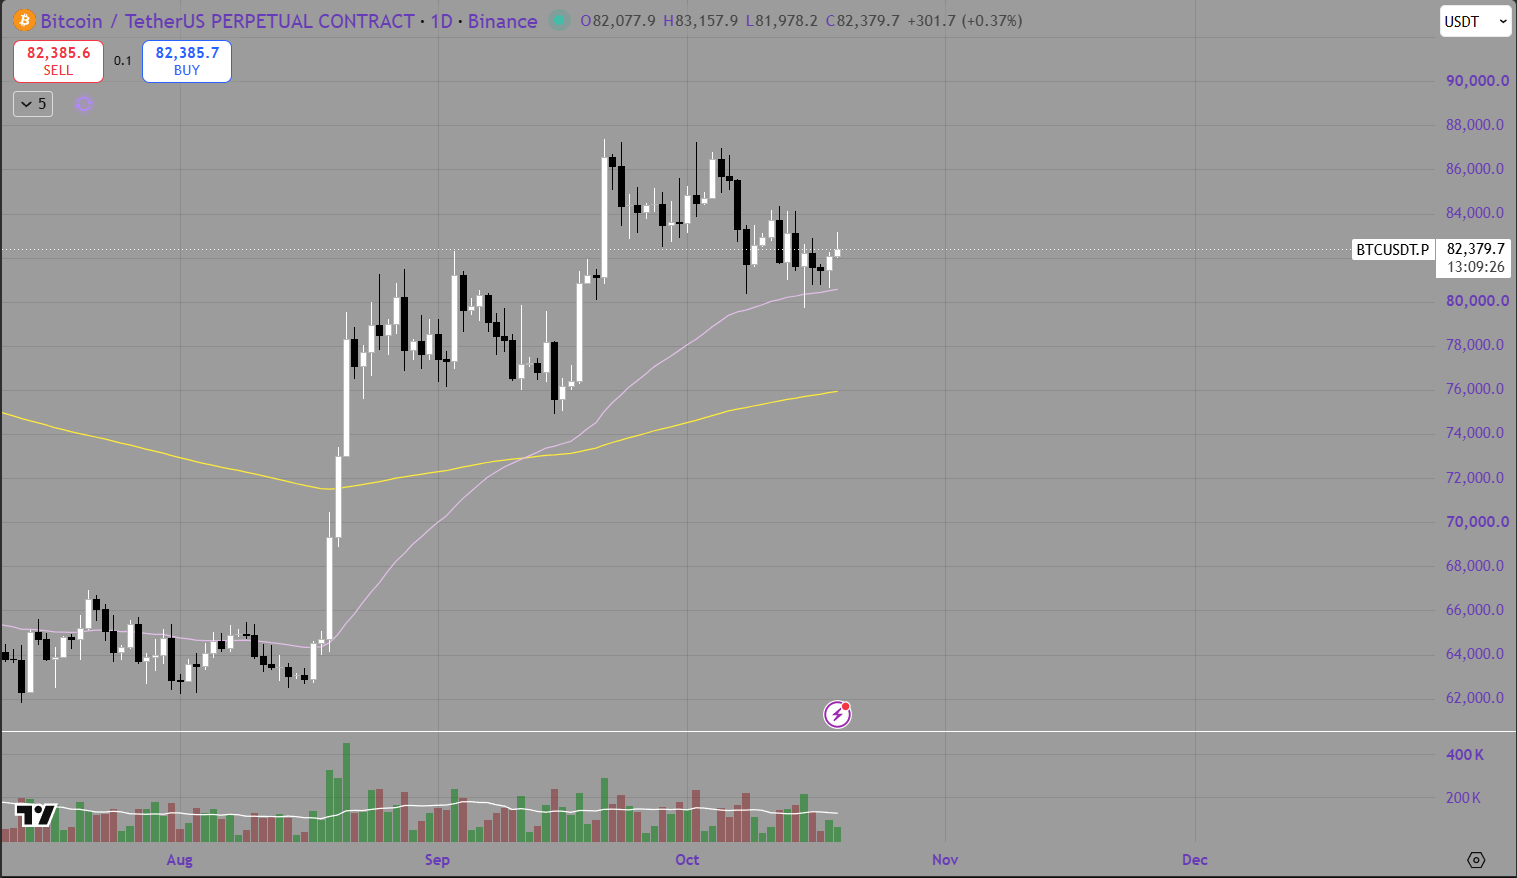
The daily chart shows a broader correction from the September and early-October highs near $87,000. Repeated failures to hold those levels have been followed by lower highs and a retreat toward the rising shorter-term daily moving average.
That moving average now sits around the low $80,000s, close to the recent downside tests. Bitcoin has so far recovered from that area, making $80,000–$80,500 an important support region. The longer-term daily moving average remains considerably lower, around $76,000.
The broader advance from August has therefore not been fully reversed, but momentum has weakened. Remaining above rising daily averages is constructive; it does not, by itself, confirm that the correction is over.
For the bullish scenario, Bitcoin needs to hold the recent support area and reclaim $83,500–$84,200. A convincing daily close above that zone would improve the structure and create scope for a recovery toward $85,000, followed by the established $86,000–$87,500 resistance region.
For the bearish scenario, another failed recovery below $84,200 would leave sellers in a strong position. A decisive daily close below $80,000, followed by an unsuccessful attempt to reclaim it, would weaken the support structure and expose the earlier trading region around $78,000–$79,000. The longer-term moving average near $76,000 would become relevant only if that deeper retracement developed.
Until resistance is reclaimed, the daily outlook remains a recovery attempt within an ongoing correction.
Summary
Bitcoin enters 19–25 October with buyers attempting to stabilise price after last week’s sell-off. The key technical distinction is between an hourly rebound and a confirmed daily recovery: the former is visible, while the latter still requires a sustained reclaim of resistance.
The economic backdrop remains challenging. Reuters reported that energy-driven US inflation and concerns about borrowing costs contributed to a broad sell-off in AI-related equities last week. That points to fragile risk appetite, although it does not establish the cause of each move in Bitcoin.
European protests have added political uncertainty. Demonstrations over living costs and public services escalated into serious unrest in France over the weekend, while smaller protests also took place in Belgium, Portugal and Italy. French equities subsequently led European losses on Monday.
War-related risks remain concentrated around energy supply. Reuters reported a tanker explosion in the Strait of Hormuz, attributed by Iran’s Revolutionary Guard navy to a naval mine, alongside continued uncertainty over the waterway’s reopening. In the Russia–Ukraine conflict, Ukraine resumed a strike on a Russian refinery after abandoning the announced energy ceasefire.
For Bitcoin, the potential transmission is through oil prices, inflation expectations, financial conditions and investor willingness to hold risk. Further disruption could weigh on sentiment, while credible de-escalation and easing energy prices could support a recovery. These are conditional market scenarios, rather than evidence that geopolitical headlines alone determine Bitcoin’s direction.
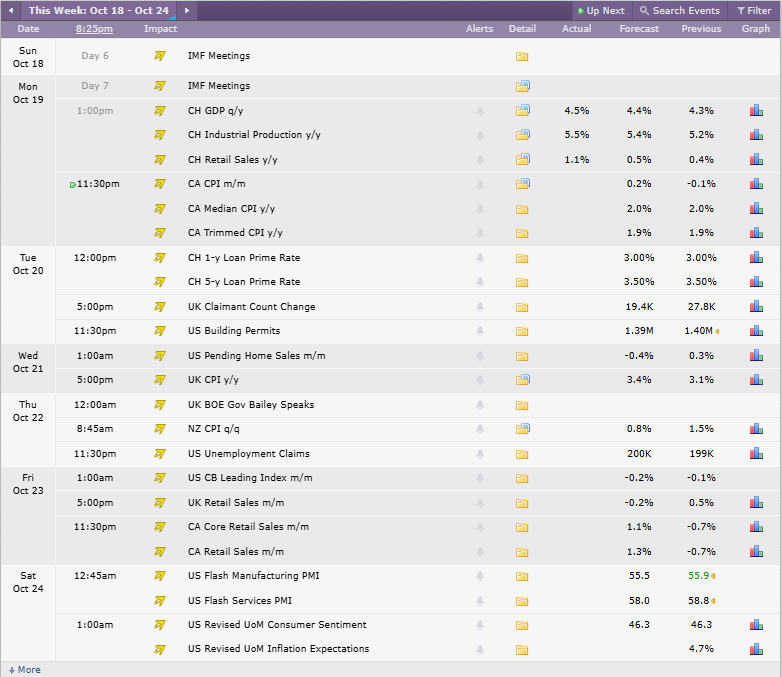
The supplied Crypto Craft calendar is labelled 18–24 October, covering the coming week’s scheduled releases. It shows no red-impact events, so there are no releases to highlight under the red-events-only approach. That does not remove the risk of volatility from unscheduled headlines.
Credit: Crypto Craft
The market map for the week is:
Bullish scenario: Hold $82,000–$82,200, clear $83,200 and reclaim $83,500–$84,200. Sustained acceptance above that zone would improve the outlook toward $85,000.
Consolidation scenario: Continue trading between the low $80,000s and $83,200 as buyers and sellers struggle to establish control.
Bearish scenario: Lose $82,000 and the weekend support levels, bringing $80,000 back into play. A confirmed daily breakdown below that level would increase the risk of a deeper retracement.
The strongest evidence of improvement would be a recovery that holds above reclaimed resistance. Until then, repeated rejection beneath $84,200 keeps the correction in focus.
