
Bitcoin Weekly Market Map: 28 September – 4 October 2026
Bitcoin began last week with a sharp move higher, reaching the $87,000 area before momentum faded. By the end of 21–27 September, the market had shifted from a breakout attempt to a test of whether buyers could defend the low $83,000s. This week’s key question is whether that pullback stabilises or develops into a deeper retracement.
Hourly Analysis
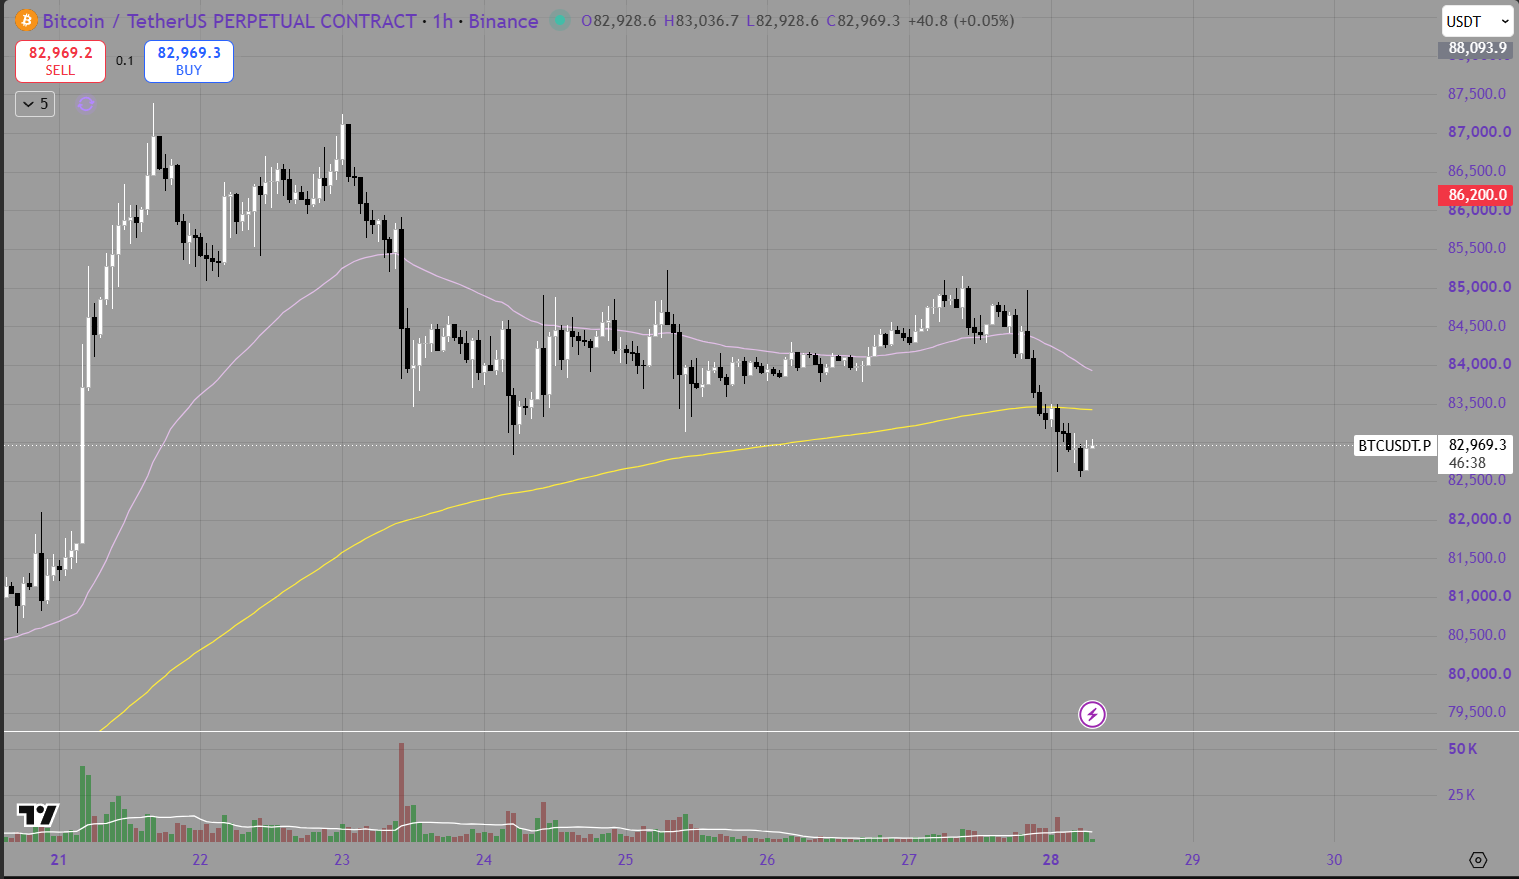
The hourly chart shows how quickly the move changed character. Bitcoin surged from around $81,000 on 21 September and made several attempts to hold above $86,000. After the final push toward $87,000 on 23 September, sellers drove price back below $85,000.
Trading then settled largely between $83,500 and $85,000. A brief recovery toward the top of that range on 27 September failed to hold. The subsequent sell-off took Bitcoin below both moving averages shown on the hourly chart, with price near $83,000 in the supplied snapshot.
For buyers, the first task is to reclaim the $83,400–$83,500 area, followed by $84,000 and the recent $84,800–$85,000 rejection zone. Until that happens, rebounds on the hourly chart remain vulnerable to selling. A sustained break below the recent $82,500 low would weaken the near-term structure further.
Daily Analysis
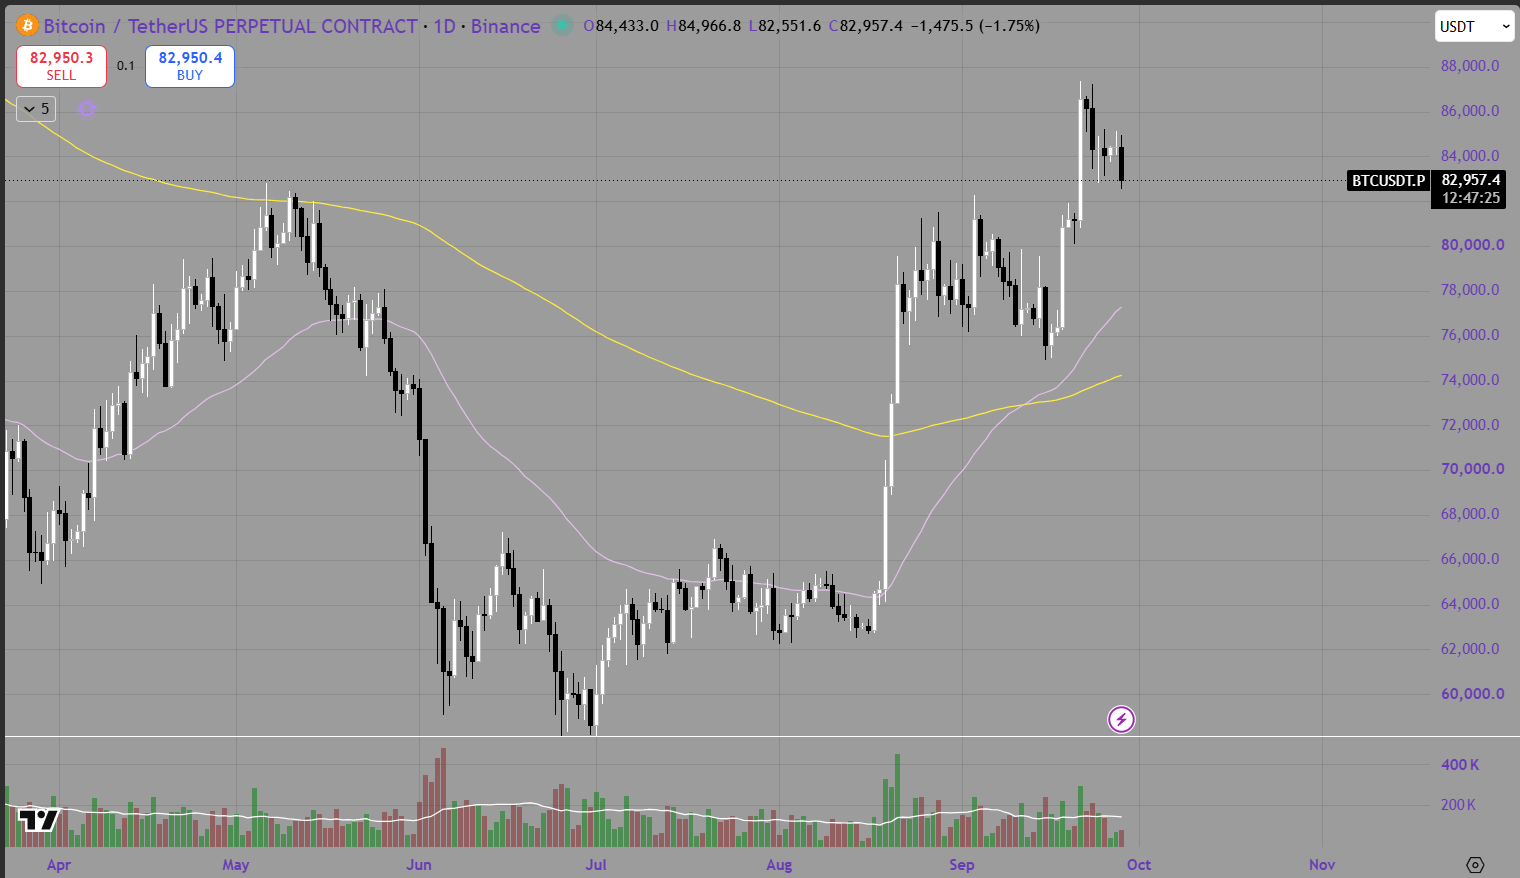
The daily chart provides a more constructive backdrop. Bitcoin’s September advance carried it from the mid-$70,000s to above $86,000, and price remains above both moving averages shown on that timeframe. The retreat from the recent high is significant, but the daily chart has not yet established that the broader advance has ended.
The $82,500–$83,000 region is the immediate area to watch. If buyers defend it and price reclaims $85,000, another test of $86,200 and the $87,000 area becomes possible. If support gives way, the next area to assess is around $80,000–$81,000, near the earlier breakout zone. Those are scenarios to monitor, rather than price targets assumed to be reached.
Summary
Last week’s breakout showed strong demand, but the failure to hold above $86,000 and the late-week loss of hourly support shifted short-term control toward sellers. The weekly map is straightforward: $82,500–$83,000 is the immediate support test; $84,000–$85,000 is the zone buyers need to reclaim; and $86,200–$87,000 is the overhead resistance area.
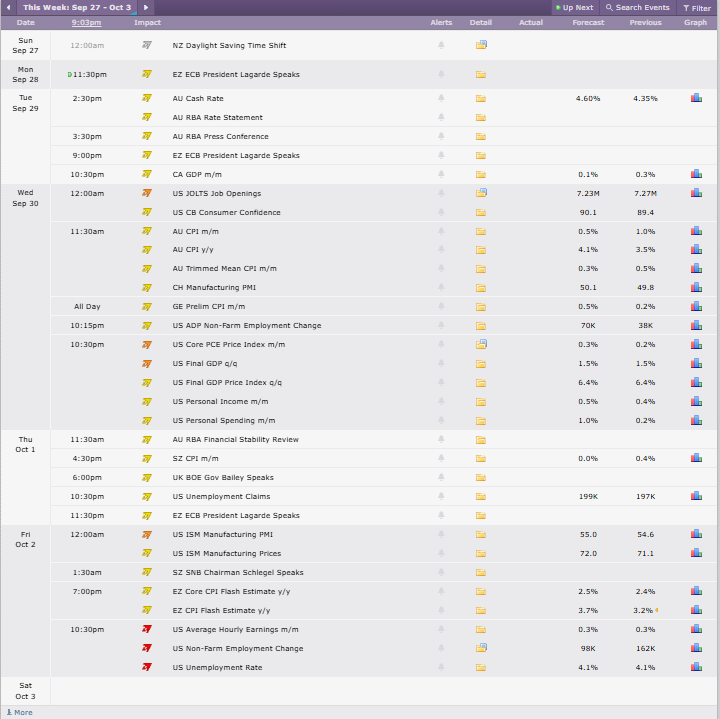
Two red-impact US events on the supplied calendar could increase volatility this week:
Wednesday, 30 September, 10:30 pm Sydney time: US Core PCE Price Index.
Friday, 2 October, 10:30 pm Sydney time: US Average Hourly Earnings, Non-Farm Employment Change and Unemployment Rate.
Credit: Crypto Craft
The BEA schedules the August personal income and outlays release, which includes core PCE, for 30 September. The BLS schedules September’s Employment Situation report for 2 October.
Watch how Bitcoin reacts at the mapped levels after those releases. A reclaim of resistance would strengthen the recovery case; a failure at resistance or a break of support would keep the pullback in focus.
