
Following on from the previous week’s consolidation around the upper-$70,000 region, Bitcoin spent the week of 31st August to 6th September holding onto the majority of its recent breakout gains.
BTC experienced significant volatility early in the week, briefly pushing above $81,000 before sharply retracing toward $79,000. Since then, Bitcoin has largely consolidated between approximately $79,000 and $80,000.
The broader technical picture remains constructive. Bitcoin continues to trade comfortably above both the daily 50 EMA and 200 EMA following August’s major breakout. However, repeated difficulty holding above $80,000 suggests buyers still need to clear this resistance before the next leg higher can develop.
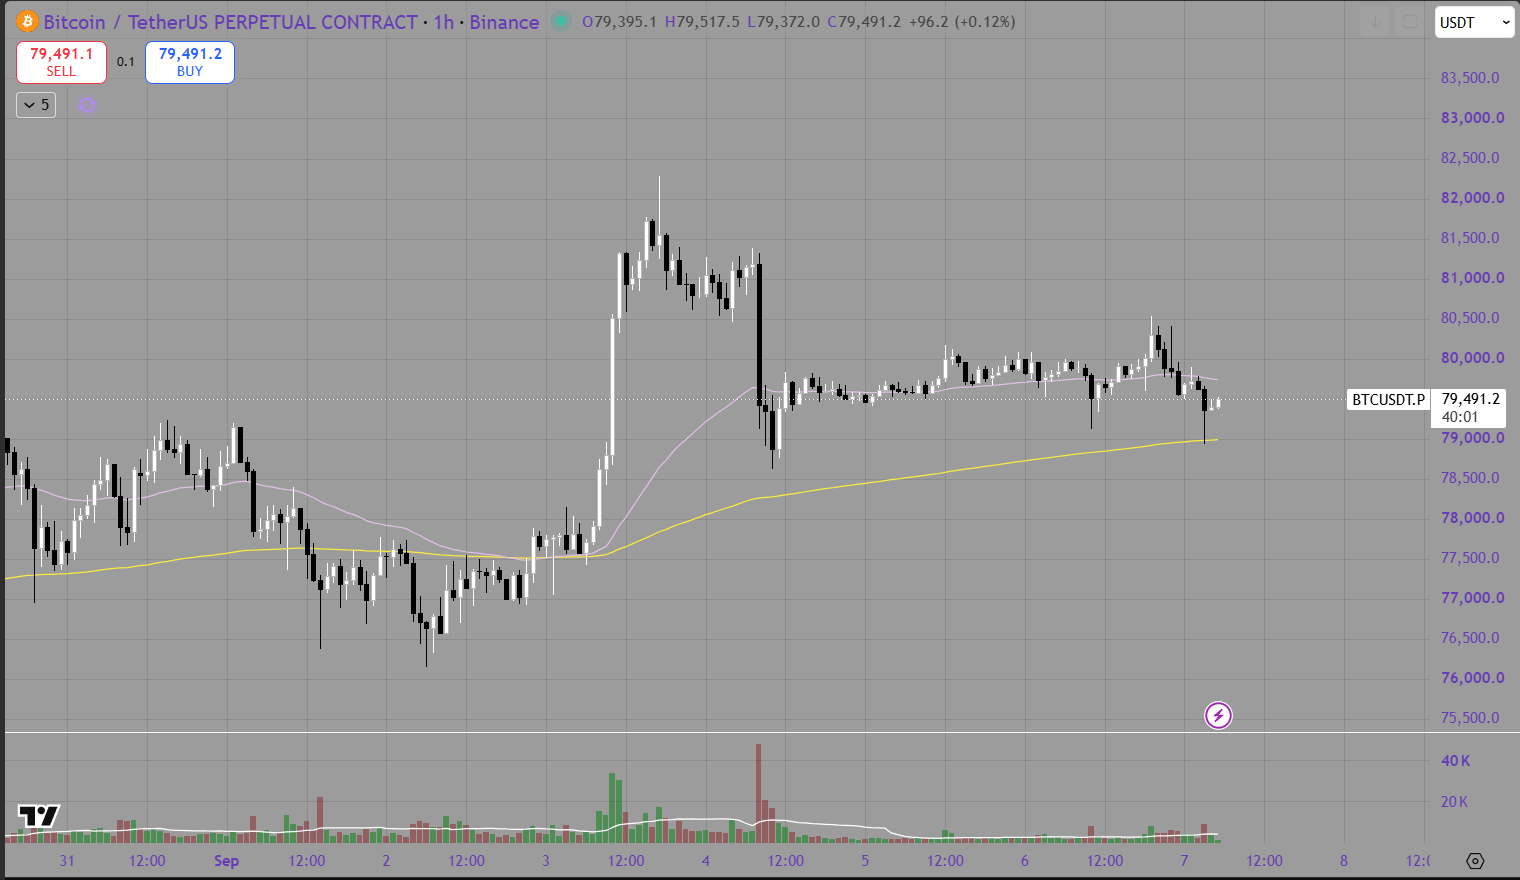
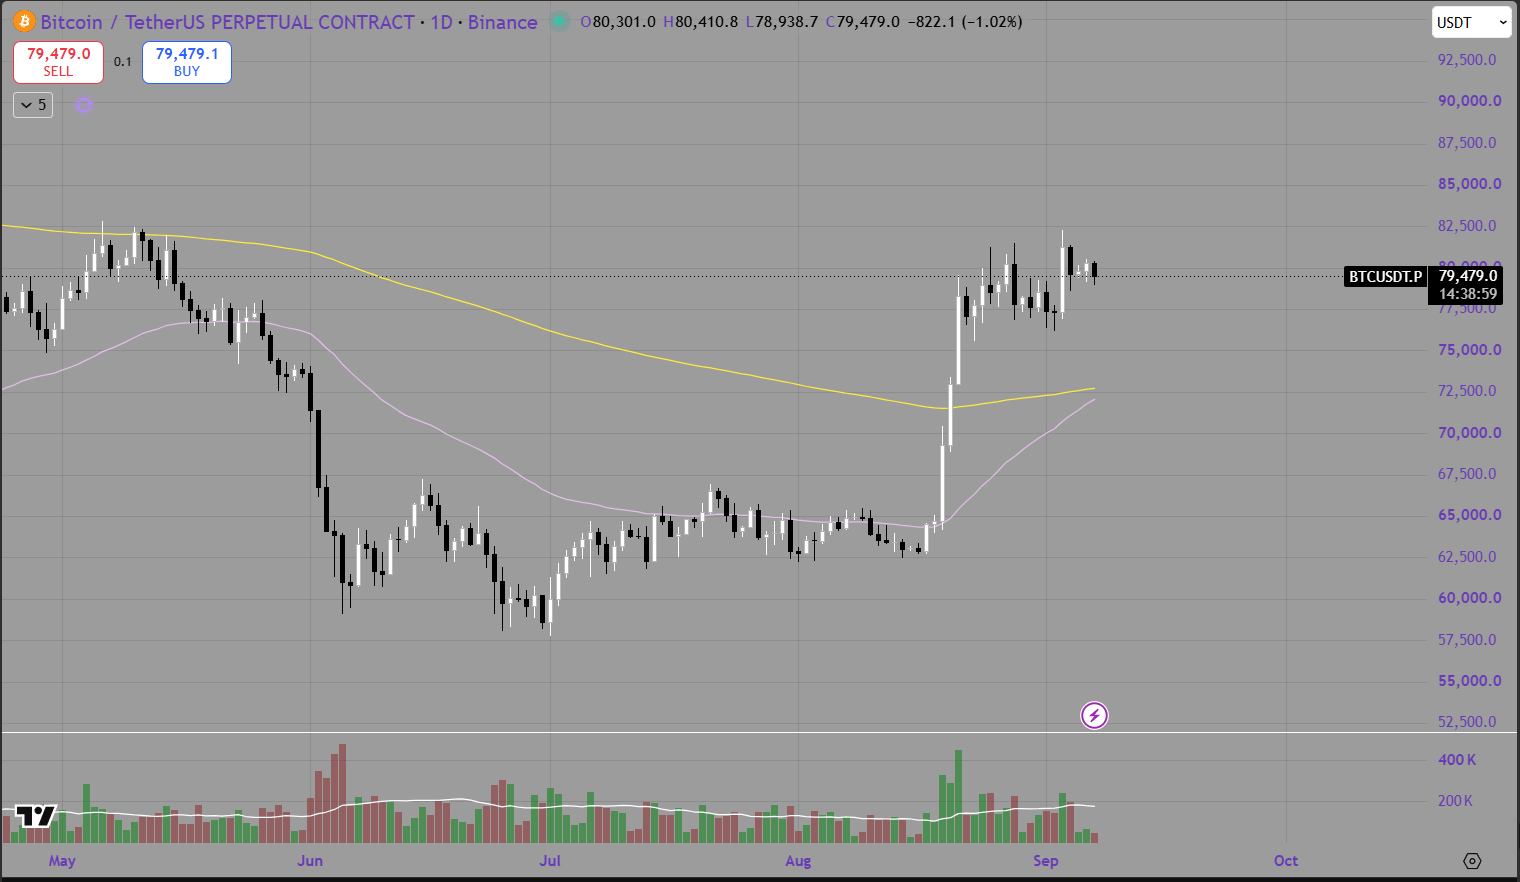
The purple line represents the 50 EMA, while the yellow line represents the 200 EMA.
Hourly Analysis
The hourly chart shows Bitcoin beginning the week around the upper-$70,000 region before producing a major breakout through $80,000.
BTC rapidly pushed toward $81,500, but the move was short-lived. Sellers responded aggressively, pushing Bitcoin back toward $79,500. Price briefly dropped beneath this level before finding demand around the $78,500 to $79,000 region.
Since then, Bitcoin has moved into a tight consolidation around $79,500.
The hourly 50 EMA is sitting just above current price and has flattened considerably, highlighting the loss of momentum following the initial breakout. The yellow 200 EMA continues rising beneath price around $79,000 and is becoming increasingly important support.
The short-term structure therefore remains constructive while BTC holds the 200 EMA.
The first resistance sits around $79,800 to $80,000. A successful reclaim would bring $80,500 back into focus, followed by the weekly high around $81,500.
On the downside, $79,000 is the immediate level to defend. A clean breakdown could expose $78,000 to $78,500, followed by stronger support around $77,000 to $77,500.
Daily Analysis
The daily chart remains significantly stronger than it was throughout June and July.
Bitcoin continues trading around $79,500 after August's breakout carried BTC decisively through both major daily moving averages. The 50 EMA is now rising rapidly from below price, while the daily 200 EMA sits considerably lower around the $72,000 region.
Most importantly, Bitcoin has not meaningfully surrendered the breakout.
The market has instead formed a consolidation between roughly $77,000 and $82,000. This suggests buyers and sellers are currently establishing a new range following the aggressive move from the mid-$60,000s.
The $80,000 to $82,000 region remains the main obstacle. Bitcoin has now tested this area several times without establishing a sustained breakout.
A daily close above $82,000 would represent an important bullish development and potentially clear the way toward $84,000 to $85,000.
On the downside, $77,000 to $78,000 remains the first major daily support. Below this, the $72,000 to $73,000 region around the daily 200 EMA represents the major structural support level.
Overall, the daily trend remains bullish while BTC continues trading above its reclaimed moving averages.
Summary
Bitcoin experienced another volatile but ultimately constructive week, briefly pushing above $81,000 before consolidating back around $79,500.
The hourly chart is currently neutral-to-bullish, with BTC testing the rising 200 EMA around $79,000. The daily structure remains considerably stronger, with Bitcoin comfortably above both major moving averages following August's breakout.
Key levels to monitor include:
Immediate resistance: $79,800 to $80,000
Higher resistance: $80,500 to $81,500
Major breakout resistance: $82,000
Initial support: $79,000
Secondary support: $78,000 to $78,500
Major daily support: $72,000 to $73,000
Looking ahead, the main red-folder events on the Crypto Craft calendar are heavily concentrated around US inflation data:
US Core PPI m/m
US PPI m/m
US Core CPI m/m
US Core CPI y/y
US CPI m/m
US CPI y/y
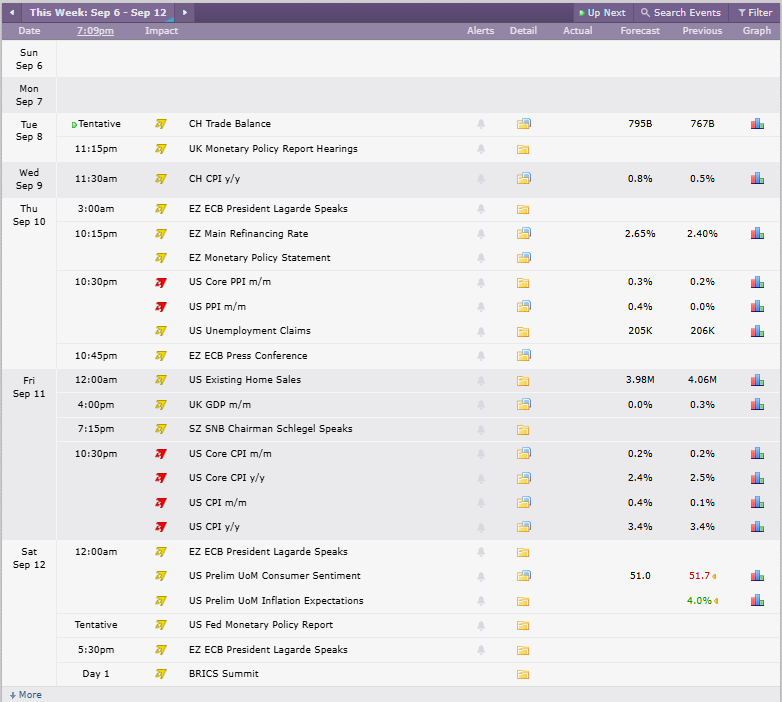
Credit: Crypto Craft
Inflation will therefore likely be the dominant scheduled macro catalyst for Bitcoin this week.
PPI will provide an early indication of upstream inflationary pressures before CPI becomes the major focus. Softer inflation readings could reinforce expectations for easier monetary conditions and potentially support Bitcoin and other risk assets.
Conversely, hotter-than-expected inflation could push bond yields higher and strengthen expectations that monetary policy remains restrictive, potentially creating renewed selling pressure across crypto.
For now, the broader Bitcoin structure remains constructive. BTC has successfully retained most of its August breakout and continues trading above its major daily moving averages. The next significant confirmation would come from a sustained break above $80,000 to $82,000, while losing $78,000 would increase the probability of a deeper short-term retracement.
