
Bitcoin Weekly Market Map: 5–11 October 2026
Bitcoin recovered during 28 September–4 October after buyers defended the low $83,000s. The week began with uneven trading below $84,500, before a stronger advance reclaimed the hourly moving averages and carried price back toward $87,000. However, repeated rejection near that level shows that buyers still face a significant barrier.
This week’s market map centres on whether Bitcoin can turn that recovery into a sustained breakout. Holding the recent higher lows would support another attempt at resistance, while losing them would bring the wider consolidation range back into focus.
Hourly Analysis
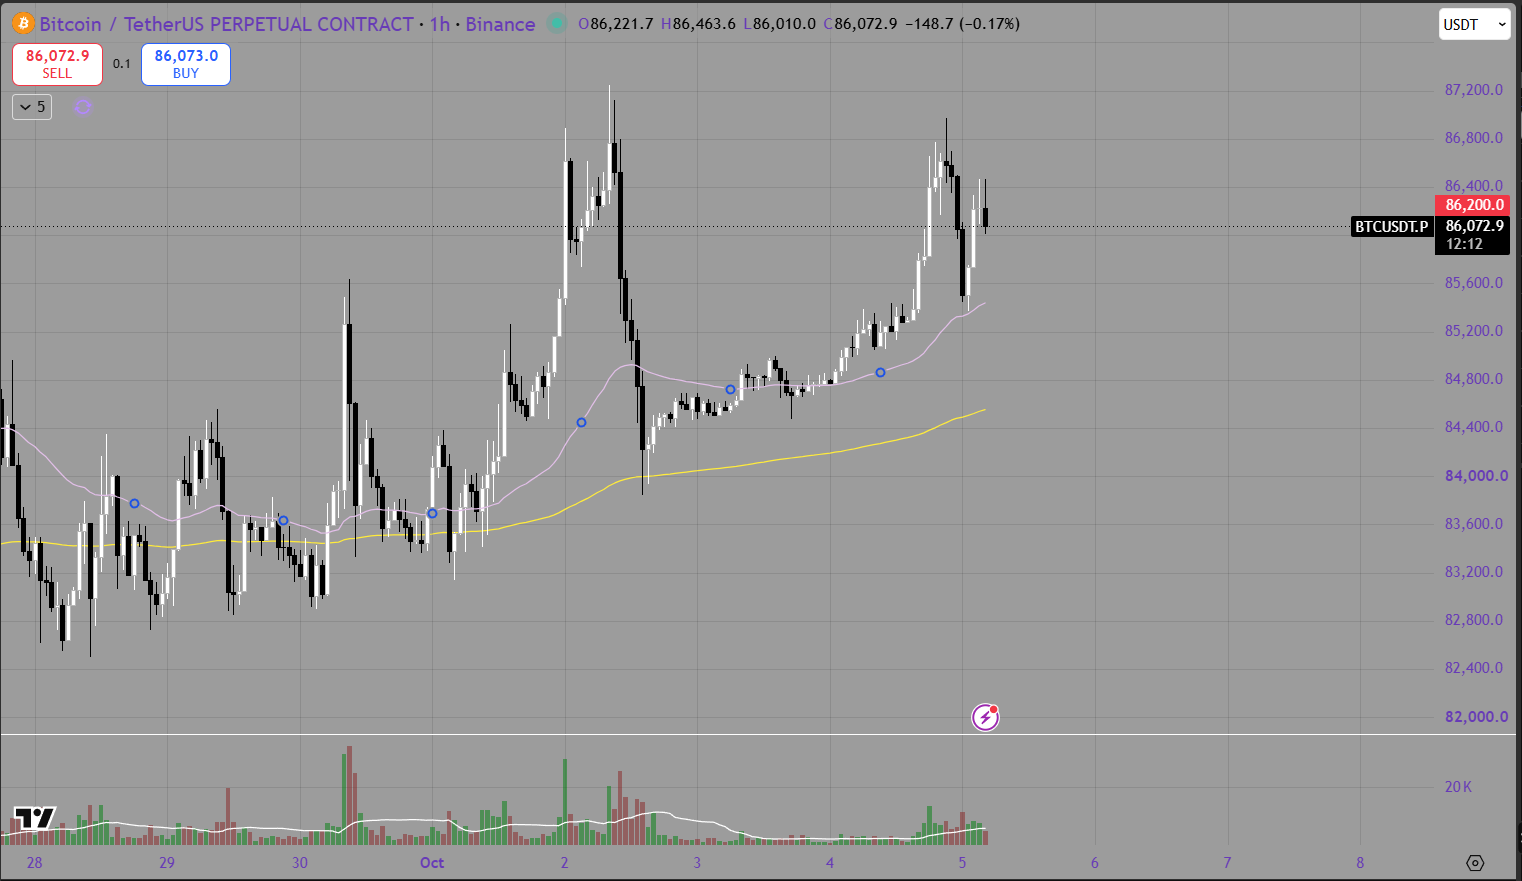
Bitcoin started the week under pressure, with several moves into approximately $82,500–$83,000 attracting buyers. Early rebounds struggled to hold, and price repeatedly crossed the moving averages without establishing a clear trend.
On 30 September, a sharp push toward $85,600 quickly reversed. The accompanying volume increase showed greater activity, but the failure to maintain the breakout left Bitcoin trading around the mid-$83,000s again.
The structure improved on 1 October. Price reclaimed both hourly moving averages and began forming higher lows, followed by a strong advance on 2 October toward $87,200. That move also failed to hold, with a sharp reversal taking Bitcoin back toward $84,000.
Buyers then stabilised the market. Trading on 3 October largely consolidated around $84,400–$85,000, before another advance on 4 October lifted Bitcoin toward $86,800–$87,000. Compared with the earlier part of the week, the recovery showed a more constructive sequence of higher lows.
The supplied chart also includes the opening of 5 October. That snapshot shows a pullback toward $85,400 followed by a rebound to around $86,000. Price remains above both hourly moving averages, although the latest rally has yet to overcome the previous high.
For the coming week, $85,400–$85,600 is the first support area to monitor, followed by the earlier consolidation zone around $84,400–$84,800. Above price, $86,200 is an immediate reference level, with the main resistance sitting around $86,800–$87,200.
A sustained break above the recent highs would strengthen the bullish structure. Conversely, losing $85,400 and then $84,400 would weaken the recovery and increase the possibility of another test of $83,000–$84,000.
Daily Analysis
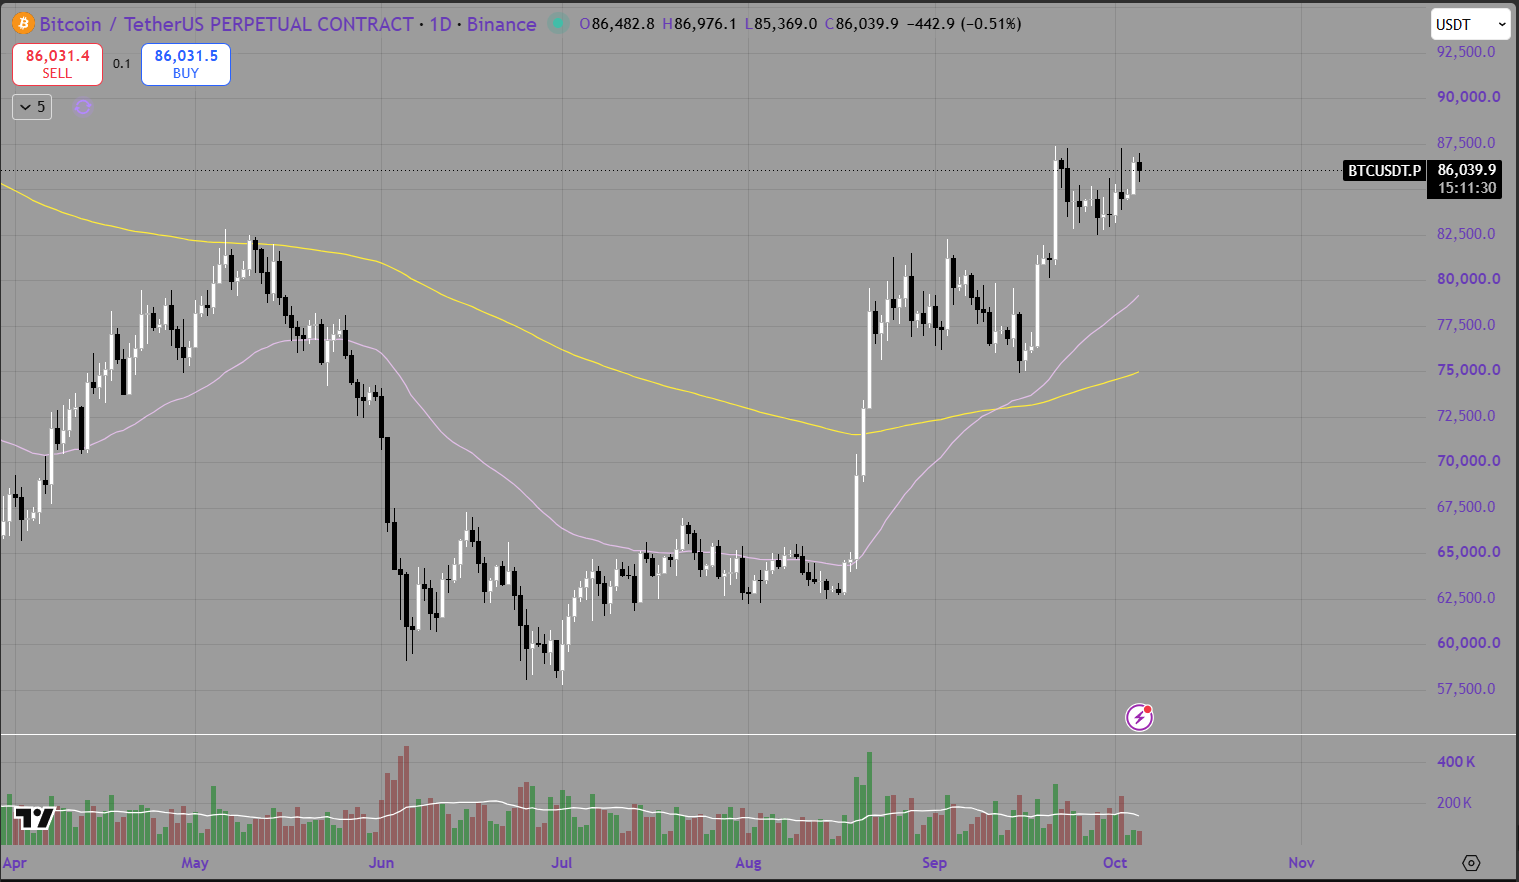
The daily chart continues to show Bitcoin consolidating above the September breakout area. Despite the pullback from approximately $87,000, buyers defended the $82,500–$83,000 region and returned price toward the upper end of the range.
Bitcoin also remains above both rising daily moving averages shown on the chart. This supports a constructive broader trend, although their distance below current price means they offer limited immediate support if the recent consolidation breaks down.
The main obstacle remains $87,000–$87,500, where several daily candles have left upper wicks. Those rejections suggest that buying momentum has not yet been strong enough to establish acceptance above resistance.
The bullish scenario requires Bitcoin to maintain its recent support structure and produce a convincing daily close above $87,500. That would strengthen the case for continuation, with the psychological $90,000 level becoming the next area to assess.
The bearish scenario begins with a failure to hold the recent higher lows, followed by renewed pressure on $82,500–$83,000. A decisive daily close below that support would weaken the consolidation structure and bring the earlier $80,000–$81,000 breakout area into consideration.
Until either boundary breaks convincingly, the daily chart remains a consolidation beneath resistance rather than a confirmed breakout.
Summary
Last week marked an improvement in Bitcoin’s short-term structure. Buyers defended the low $83,000s, reclaimed the hourly moving averages and pushed price back toward $87,000. The remaining challenge is converting those repeated tests of resistance into a sustained move higher.
For 5–11 October, the key areas are:
Immediate support: $85,400–$85,600.
Secondary support: $84,400–$84,800.
Major daily support: $82,500–$83,000.
Main resistance: $86,800–$87,500.
Credit: Crypto Craft
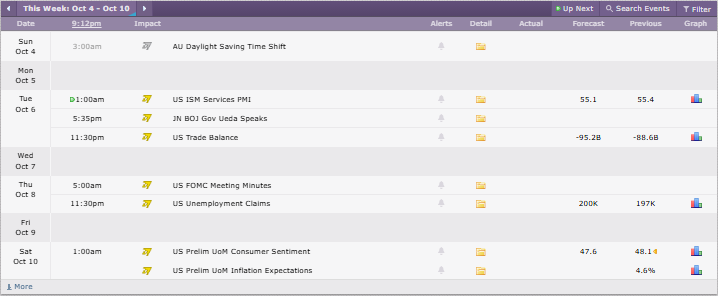
The supplied Crypto Craft calendar covers 4–10 October and shows no red-impact events. Following the red-events-only approach, there are therefore no calendar releases to highlight from this screenshot.
The focus remains on price confirmation. Holding support and closing above the recent highs would strengthen the continuation case. Another rejection at resistance, followed by a loss of the higher lows, would favour further consolidation or a deeper pullback.
