
Weekly Bitcoin Price Analysis & Forecasts the 10th August - 16th August 2026
Following on from last week’s recovery toward the $65,000 region, Bitcoin spent the week of 10th August to 16th August 2026 giving back some of that momentum before attempting another short-term recovery.
BTC moved lower through the first half of the week, falling from above $65,000 into the low-$62,000 region. Buyers eventually stepped back in around $62,500 to $62,800, allowing price to recover toward $63,500 by the end of the period.
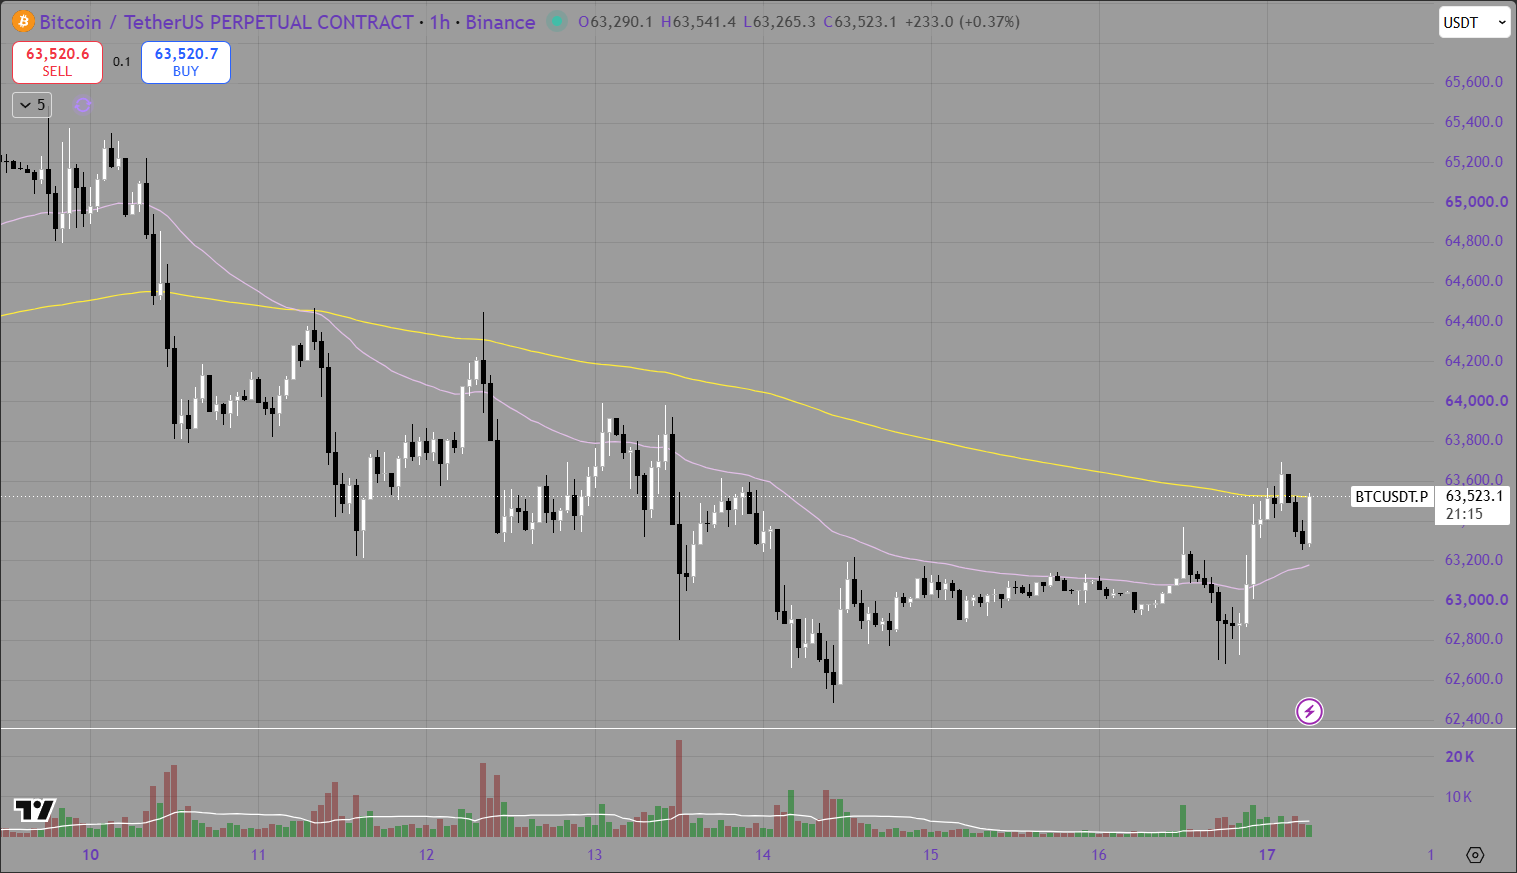
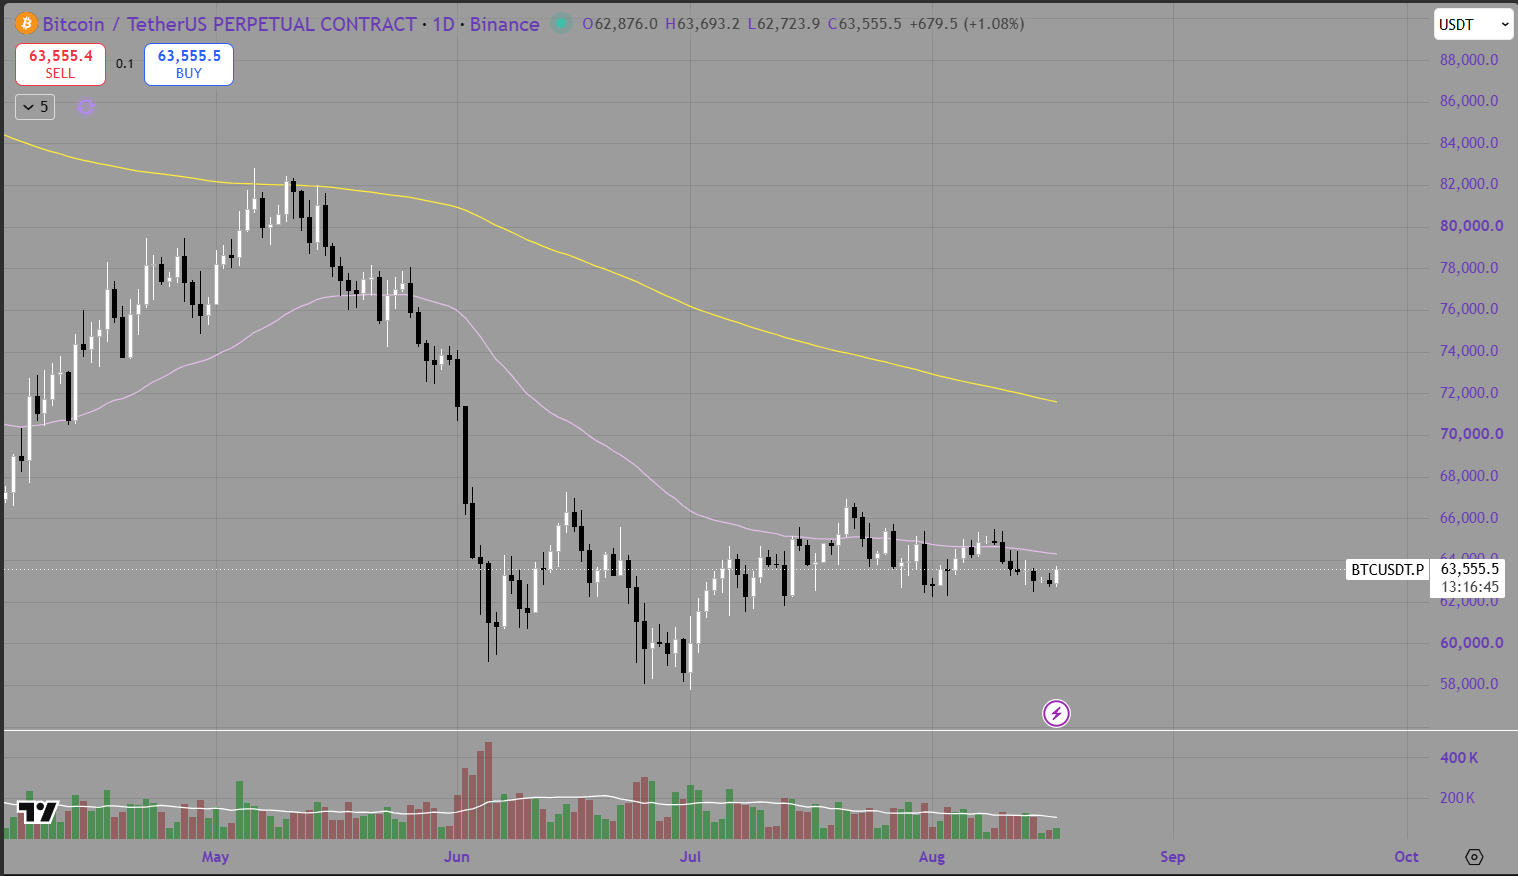
The hourly chart shows Bitcoin trying to rebuild momentum after reclaiming the 50 EMA, although the 200 EMA remains directly overhead. The daily chart is less convincing, with BTC still trading below both major moving averages and continuing to consolidate within the broader range that has developed since June.
The purple line represents the 50 EMA, while the yellow line represents the 200 EMA.
Hourly Analysis
The hourly chart shows a relatively weak start to the week.
Bitcoin opened above $65,000 but quickly lost momentum, breaking below the 50 EMA and then falling through the 200 EMA around the mid-$64,000 region.
Price continued lower throughout the week, with several recovery attempts failing beneath the declining moving averages. BTC eventually found support around $62,500 to $62,800, where buyers began to absorb selling pressure.
The reaction from this area has been constructive. Bitcoin has since pushed back above the hourly 50 EMA and is now trading around $63,500.
However, the yellow 200 EMA remains immediately overhead around $63,500 to $63,600. This creates an important short-term decision point.
A clean break and hold above $63,600 could allow BTC to target $64,000, followed by $64,400 to $64,500. If buyers can reclaim that region, the short-term structure would improve considerably.
On the downside, $63,000 is the first support level to watch. Below that, the recent $62,500 to $62,800 lows become important again.
For now, the hourly chart is improving, but Bitcoin still needs to reclaim the 200 EMA before the move can develop into a stronger recovery.
Daily Analysis
The daily chart continues to show Bitcoin trading within a broad consolidation following the major June decline.
BTC has spent much of July and August ranging between approximately $62,000 and $66,000. Attempts to break above the upper end of this range have repeatedly struggled, while buyers have continued to appear around the lower-$60,000 region.
The purple daily 50 EMA remains above price around the mid-$64,000 region and continues to act as resistance. Bitcoin needs to reclaim this level before the daily structure can begin to improve meaningfully.
The yellow 200 EMA remains significantly higher near the low-$70,000 region, confirming that the broader trend is still under pressure.
The immediate daily support sits around $62,000 to $63,000. As long as Bitcoin continues holding this region, the market may continue consolidating and attempting to form a broader base.
A move above $65,000 to $66,000 would be the first major bullish signal and could open the door toward $68,000. Conversely, a breakdown below $62,000 would increase the risk of another move toward $60,000 and potentially the previous lows near $58,000.
Summary
Bitcoin experienced another mixed week, falling from above $65,000 into the low-$62,000 region before recovering toward $63,500.
The hourly chart is beginning to improve after BTC reclaimed the 50 EMA, but the 200 EMA remains the immediate resistance level. The daily chart remains cautious, with price still below both major moving averages.
Key levels to monitor include:
Immediate resistance: $63,500 to $63,600
Higher resistance: $64,000 to $64,500
Major resistance: $65,000 to $66,000
Initial support: $63,000
Key support: $62,500 to $62,800
Major support: $60,000 to $62,000
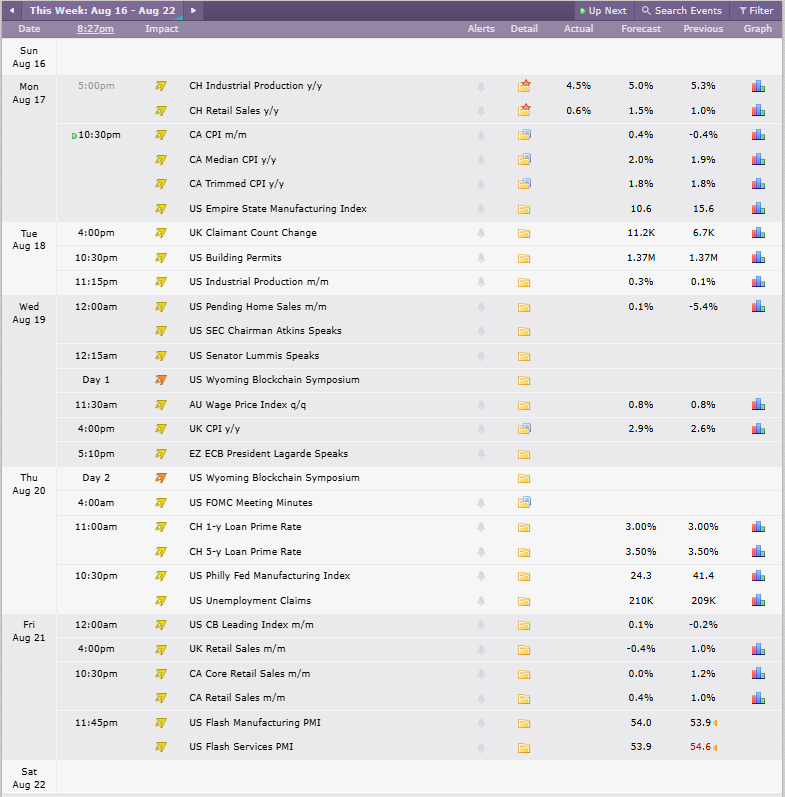
Looking ahead, the main red-folder events from the Crypto Craft calendar are:
US Core CPI m/m
US Core CPI y/y
US CPI m/m
US CPI y/y
Credit: Crypto Craft
These inflation figures remain one of the most important scheduled catalysts for Bitcoin and broader risk markets.
Softer-than-expected inflation could support expectations for easier monetary policy and potentially improve sentiment across crypto and equities. Hotter CPI data could have the opposite effect by pushing bond yields higher and increasing expectations that monetary policy remains restrictive.
The calendar also shows FOMC Meeting Minutes later in the week, although it is not marked as a red event. This could still influence expectations around the Federal Reserve’s outlook if the minutes reveal meaningful disagreement around inflation or future policy.
For now, Bitcoin remains inside a broader consolidation. A sustained reclaim of $64,500 would improve the short-term outlook, while a move above $65,000 to $66,000 would provide stronger evidence that buyers are regaining control.
