
Weekly Bitcoin Price Analysis & Forecasts the 3rd August - 9th August 2026
Following on from last week’s weakness around the low-$62,000 region, Bitcoin showed a much stronger recovery during the week of 3rd August to 9th August 2026.
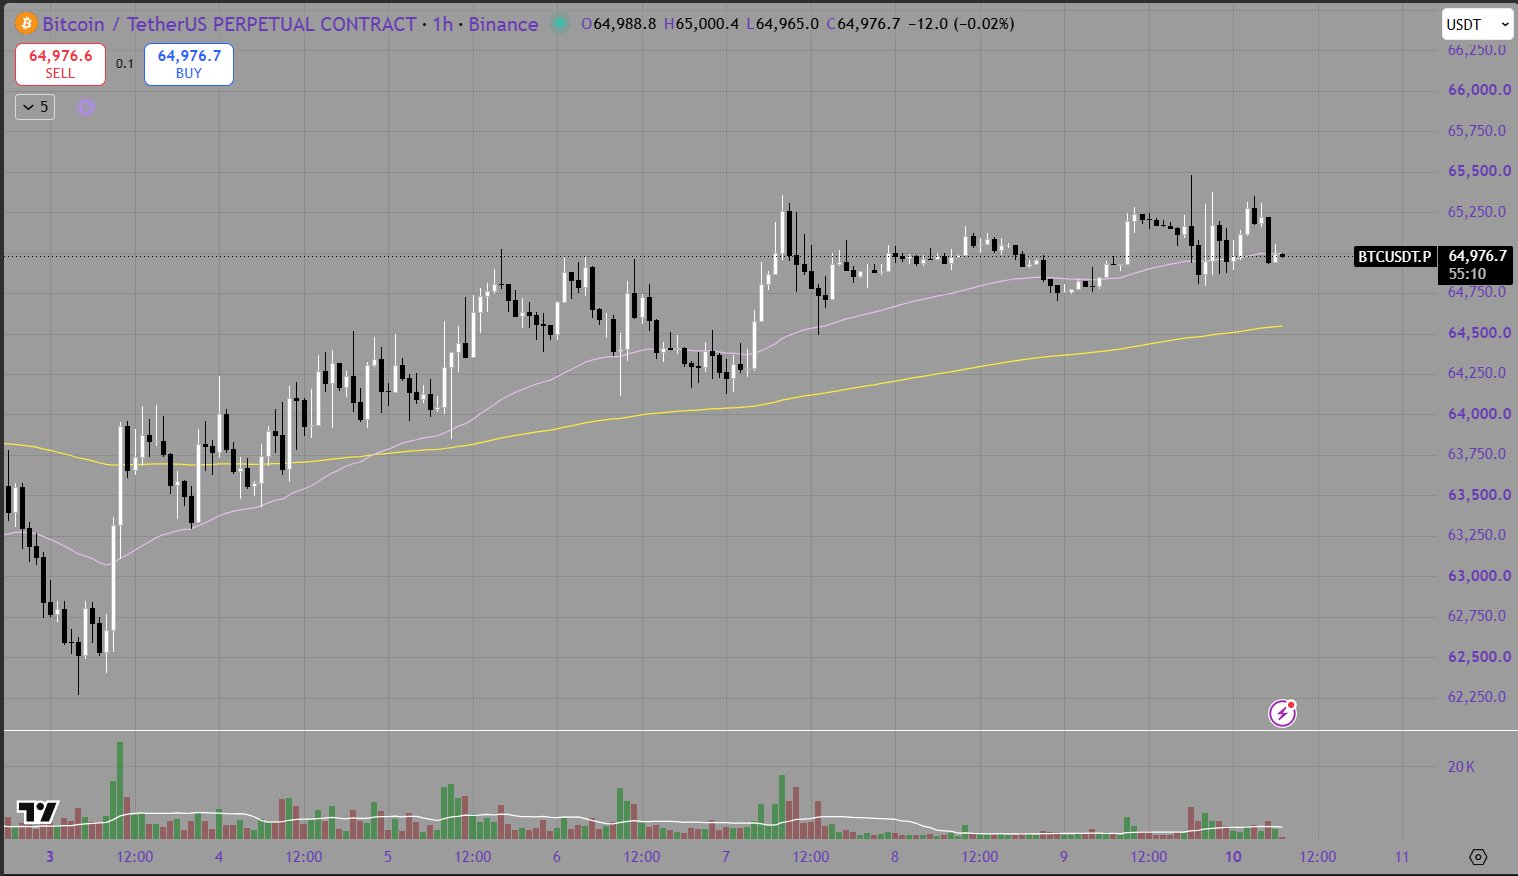
BTC climbed steadily from the low-$62,000 area and pushed back toward $65,000, with the hourly chart showing a clear improvement in momentum. Price reclaimed both the 50 EMA and 200 EMA and spent the latter part of the week consolidating above them.
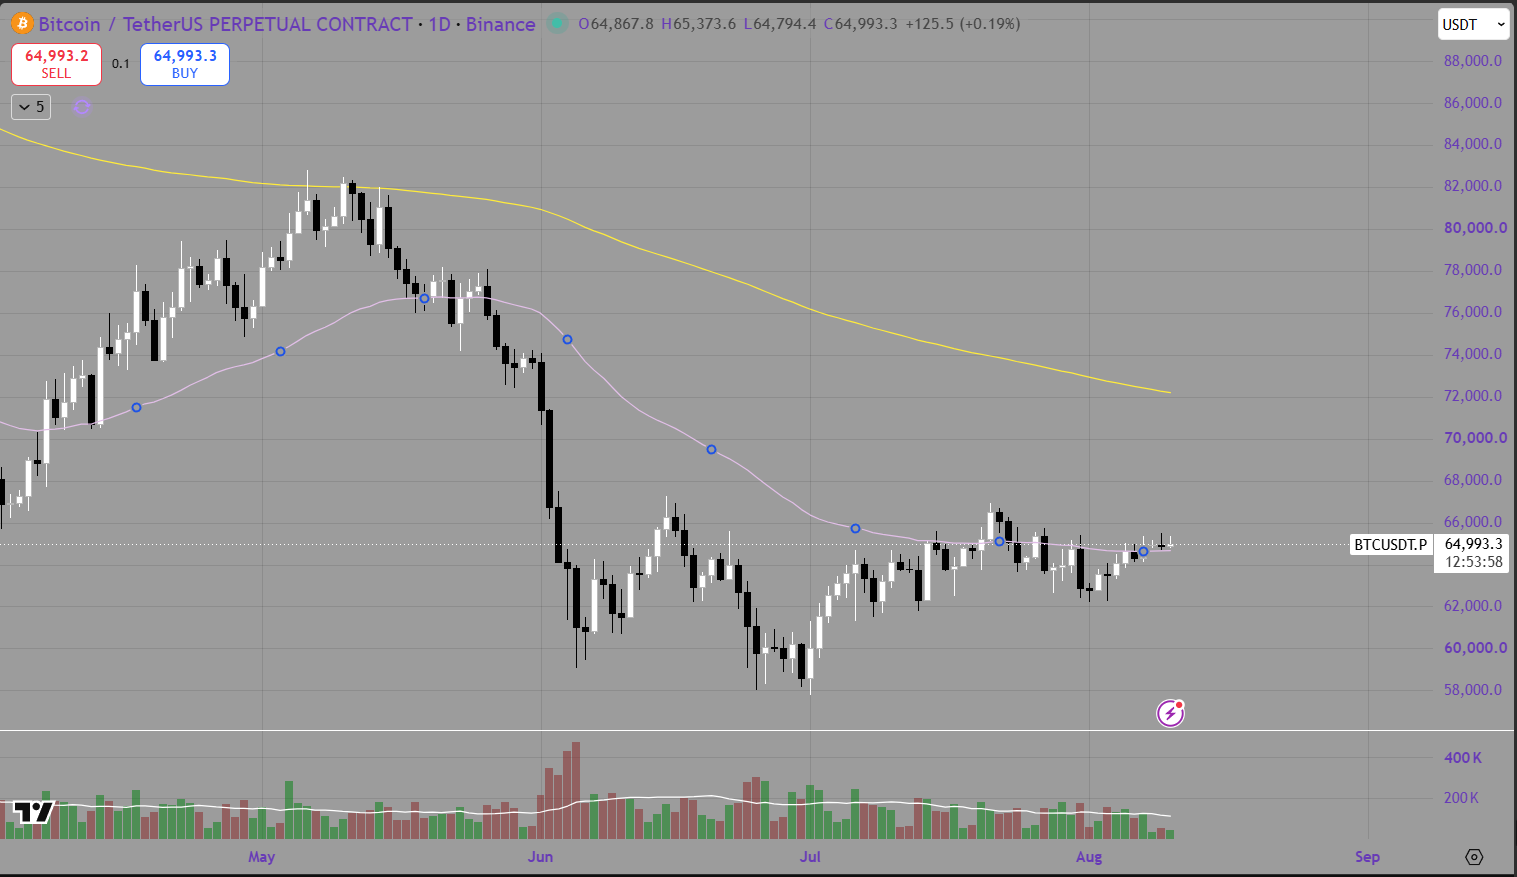
The daily chart has also improved, with Bitcoin now trading back around the $65,000 region. However, BTC is still below the daily 200 EMA, meaning the broader trend has not yet fully turned bullish.
The purple line represents the 50 EMA, while the yellow line represents the 200 EMA.
Hourly Analysis
The hourly chart shows a clear shift in short-term momentum.
Bitcoin began the week around $62,500 before breaking higher and reclaiming the $63,500 to $64,000 region. From there, price continued to build higher lows and eventually moved above both major hourly moving averages.
The strongest part of the move came as BTC pushed through $64,500 and into the $65,000 to $65,250 area. Since then, price has consolidated rather than sharply rejected, which is constructive.
The key short-term support now sits around $64,750 to $65,000, close to the hourly 50 EMA. Below that, the 200 EMA near $64,400 to $64,500 becomes the more important support area.
On the upside, Bitcoin is testing resistance around $65,250 to $65,500. A clean break above this zone could open the door toward $66,000, followed by the recent higher resistance around $66,500.
For now, the hourly structure remains constructive while BTC holds above the major moving averages.
Daily Analysis
The daily chart shows Bitcoin continuing to recover from the June and July lows.
BTC has pushed back into the $65,000 region and is now testing the daily 50 EMA. This is an important level because the 50 EMA has acted as resistance throughout much of the broader decline.
A sustained daily close above the $65,000 to $66,000 region would be an encouraging development and could suggest the recovery is beginning to gain more momentum.
However, the yellow daily 200 EMA remains much higher, around the low-$70,000 region. Bitcoin remains below this level, so the larger trend still requires further confirmation.
The main daily support sits around $63,000 to $64,000. As long as BTC continues holding above this region, the recovery structure remains intact.
A break above $66,000 could bring $68,000 into focus, while a move back below $63,000 would weaken the recent improvement and increase the risk of another test toward $60,000 to $62,000.
Summary
Bitcoin had a constructive week, recovering from the low-$62,000 region and pushing back toward $65,000.
The hourly chart has improved significantly, with BTC reclaiming both the 50 EMA and 200 EMA. The daily chart is also showing progress, although Bitcoin still needs to reclaim higher resistance and eventually the daily 200 EMA before the broader trend can be considered fully bullish.
Key levels to watch include:
Immediate resistance: $65,250 to $65,500
Higher resistance: $66,000 to $66,500
Upside target: $68,000
Initial support: $64,750 to $65,000
Key support: $64,000 to $64,500
Major support: $62,000 to $63,000
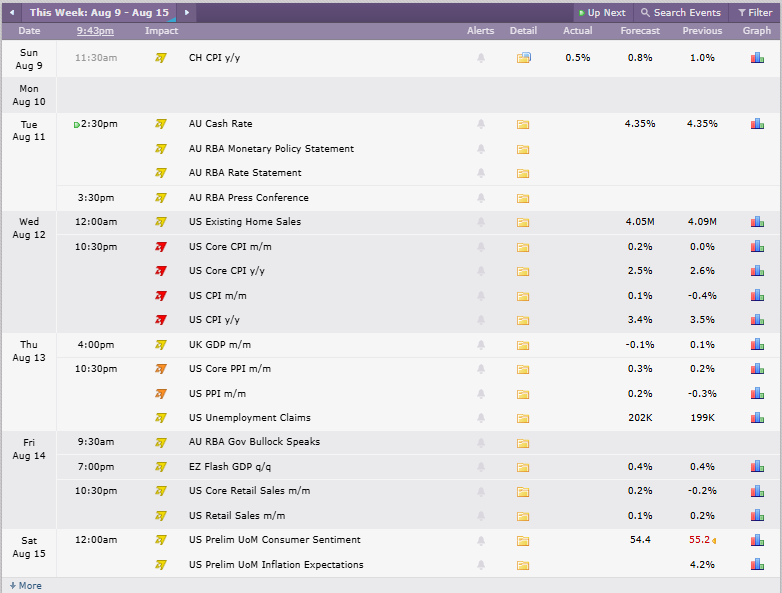
The main red-folder events on the Crypto Craft calendar are:
US Core CPI m/m
US Core CPI y/y
US CPI m/m
US CPI y/y
Credit: Crypto Craft
These inflation releases could be the biggest scheduled catalyst for Bitcoin this week. Softer-than-expected inflation may support expectations for easier financial conditions and help risk assets, while hotter CPI data could lift bond yields and put renewed pressure on BTC.
For now, Bitcoin’s short-term structure has improved. Holding above $64,000 keeps the recovery intact, while a clean break through $65,500 to $66,000 would strengthen the bullish case further.
