
Weekly Bitcoin Price Analysis & Forecasts the 11th May - 17th May 2026
Following on from last week’s bullish recovery, Bitcoin started to lose some momentum through the week of 11th May to 17th May 2026. BTC had previously pushed into the low-$80,000 region, but this week saw price reject from that area and pull back toward the high-$76,000 region.
The broader structure is still much healthier than the heavy breakdown phase seen earlier in the year, but the short-term chart has started to weaken. The move from the April lows into May was strong, but Bitcoin is now testing whether that recovery can hold or whether the market needs a deeper retracement before attempting another push higher.
Macro conditions remain a major factor. Oil prices surged to a two-week high after renewed Middle East escalation, with Reuters reporting Brent crude reaching around $112 and WTI peaking near $108.70. That matters for Bitcoin because higher oil prices can feed inflation fears, support higher bond yields, and pressure broader risk assets.
Hourly Analysis (1H)
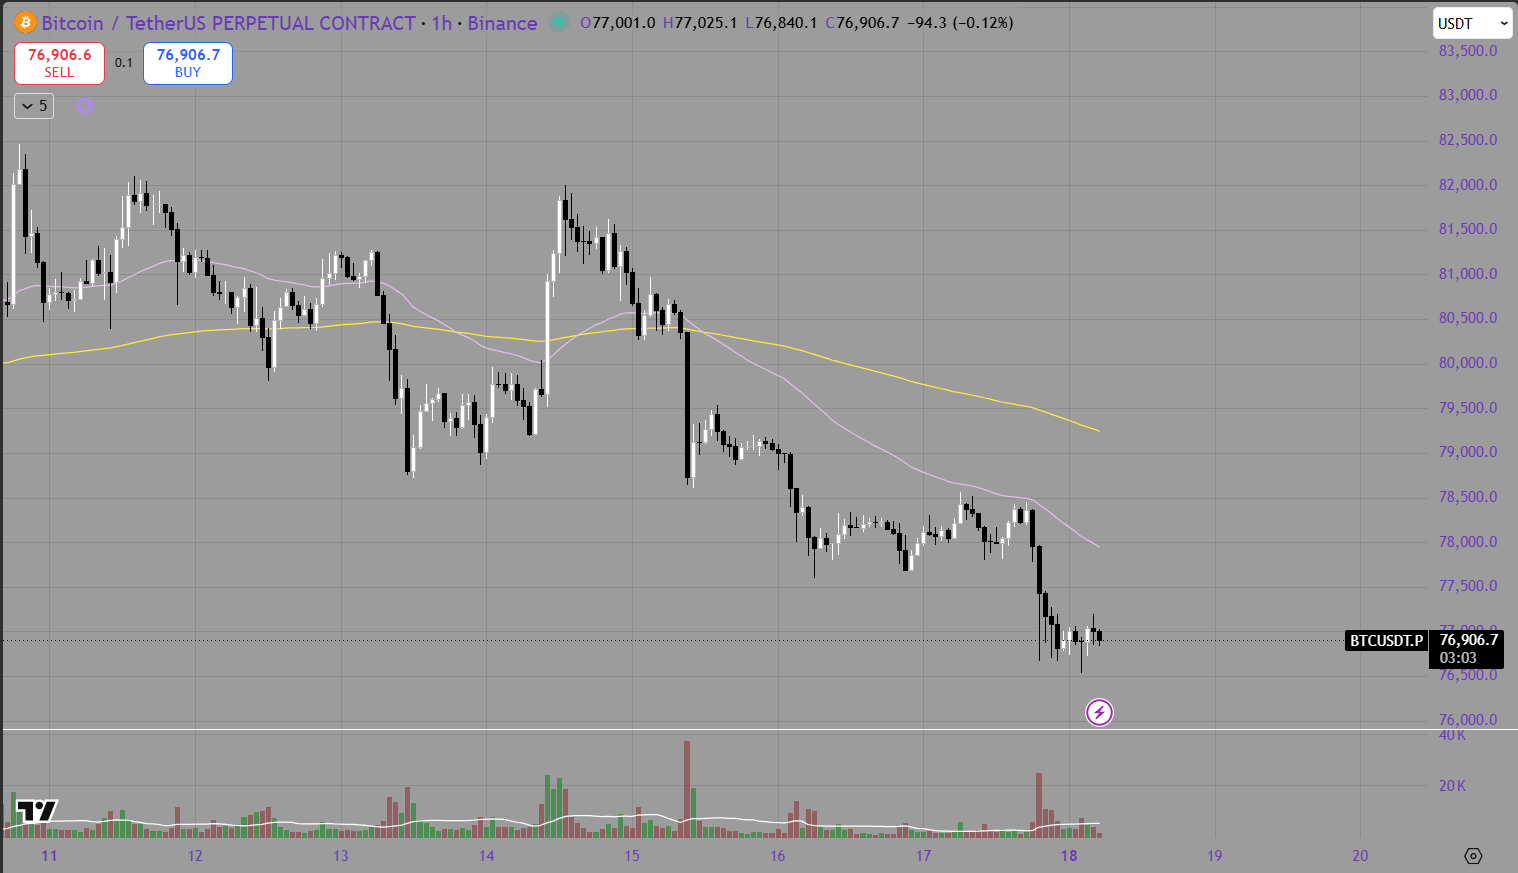
The hourly chart shows that Bitcoin entered the week in a strong position but gradually rolled over. Price was trading above both key moving averages earlier in the week, with the purple line acting as the 50 EMA and the yellow line acting as the 200 EMA. This initially supported the bullish case, as buyers were still defending the trend and price was holding above important short-term structure.
However, the rejection from the $81,000 to $82,000 region changed the tone. BTC failed to continue higher and began forming lower highs on the hourly chart. Once price slipped below the 50 EMA, momentum started to shift back toward sellers.
The more important warning sign came when Bitcoin lost the hourly 200 EMA. The yellow 200 EMA had been acting as a key support level during the recovery, so losing that area showed that short-term momentum was no longer as strong as it was last week.
After breaking lower, BTC moved toward the $77,000 region and began consolidating around the lows. This area is now important. If Bitcoin can hold around $76,500 to $77,000 and reclaim the 50 EMA, the pullback may still be viewed as a healthy reset after a strong move. However, if BTC loses this level cleanly, the next leg lower could target the mid-$75,000 region.
For now, the hourly chart has shifted from bullish to cautious. Buyers are still present, but sellers have taken control of the short-term trend.
Daily Analysis (1d)
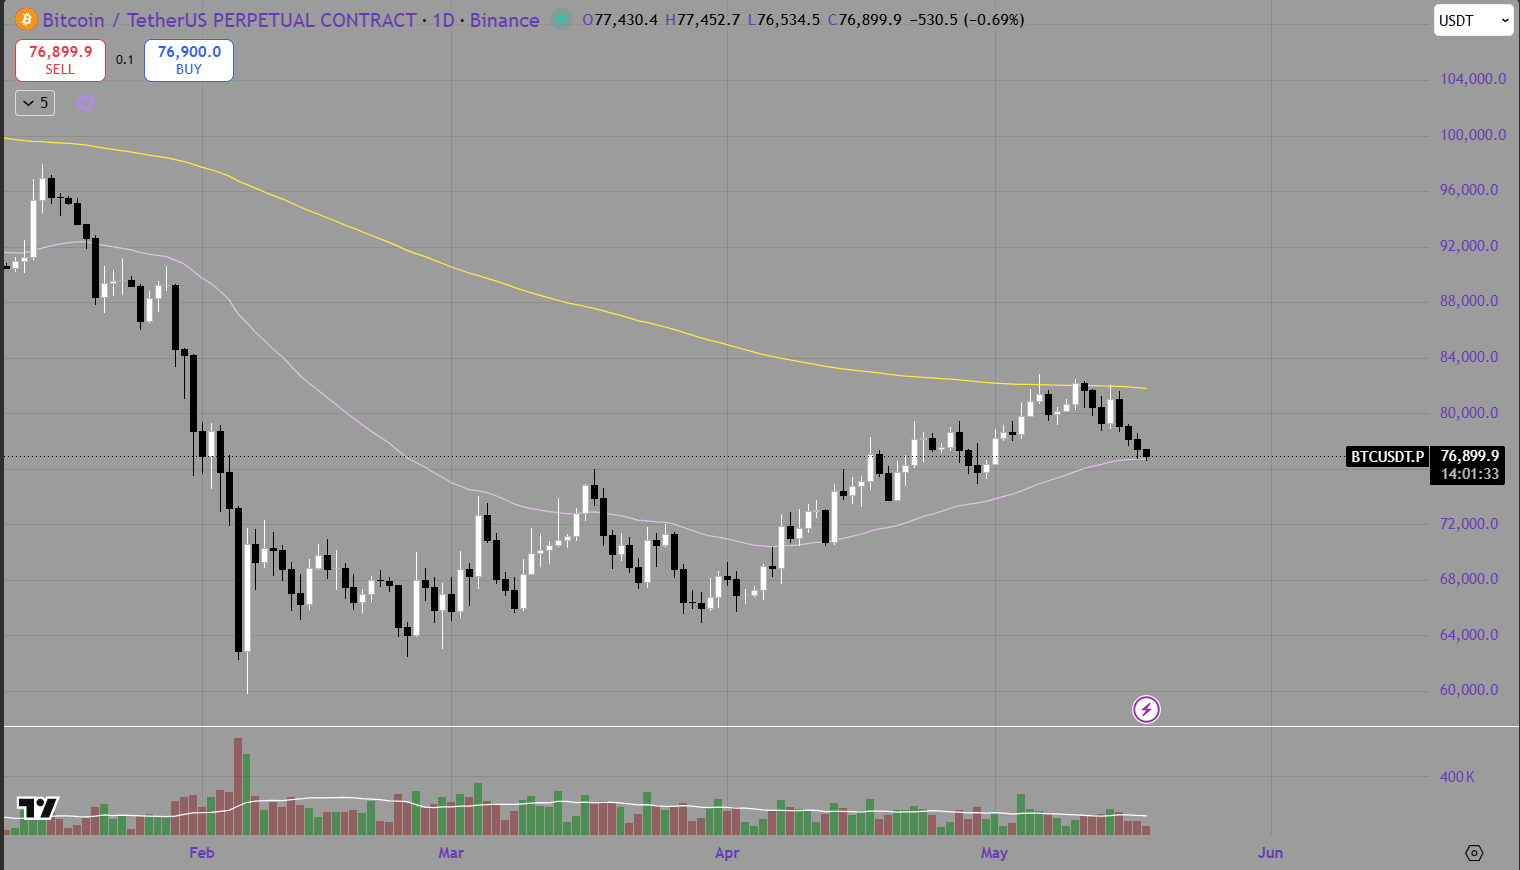
The daily chart gives a more balanced view. Bitcoin is still in a broader recovery structure from the February lows, but this week’s pullback shows that the move into the low-$80,000 region has met resistance.
BTC had been moving strongly higher from the mid-$60,000 region into the low-$80,000s, but the daily 200 EMA remains a major barrier. The yellow line on the daily chart is still above price and continues to act as the larger trend resistance. Until Bitcoin can break and hold above this level, the broader move should still be treated as a recovery phase rather than a confirmed macro reversal.
The daily 50 EMA, shown by the purple line, is now the key support area to monitor. Price has pulled back toward this zone, and how BTC reacts here will be important. If buyers defend the daily 50 EMA, the structure can remain constructive. A strong bounce from this area would suggest that the market is simply retesting support after a failed attempt at the daily 200 EMA.
However, if BTC loses the daily 50 EMA, the recovery structure becomes weaker. That would suggest the move into the low-$80,000s was rejected more seriously and that the market may need to search for lower support before rebuilding.
Volume also supports a cautious view. The move lower has come with selling pressure, but not yet a full capitulation-style breakdown. This means the market has weakened, but it has not completely reversed the broader recovery.
The surge in oil prices adds another risk layer. Reuters reported that oil gained strongly as escalating tensions in the Middle East increased fears around supply disruption, particularly after attacks on infrastructure and continued uncertainty around the Strait of Hormuz. Rising oil prices have also contributed to inflation concerns and pressure across bond markets, with Reuters reporting that high oil prices and rising global bond yields have been weighing on broader markets.
This is important because Bitcoin’s recovery is happening in a macro environment that is still fragile. If oil keeps moving higher and bond yields remain elevated, risk appetite could stay under pressure.
Summary
Bitcoin had a more cautious week after last week’s strong bullish push. Price rejected from the low-$80,000 region and pulled back toward the high-$76,000 area. The hourly chart has weakened after BTC lost both the 50 EMA and 200 EMA, while the daily chart is now testing whether the broader recovery can hold above the daily 50 EMA.
The key technical takeaway is that Bitcoin is still recovering, but momentum has cooled. A reclaim of the hourly 50 EMA and a push back above $78,000 would help repair the short-term structure. However, a clean loss of the $76,500 to $77,000 area could open the door for a deeper pullback.
Oil prices remain a major macro risk. The latest surge in crude prices has increased inflation concerns and added pressure to bond markets, which can weigh on risk assets like Bitcoin.
Looking ahead, the main red-folder events from the Crypto Craft screenshot are:
US Core CPI m/m
US CPI m/m
US CPI y/y
US Fed Chair Nomination Vote
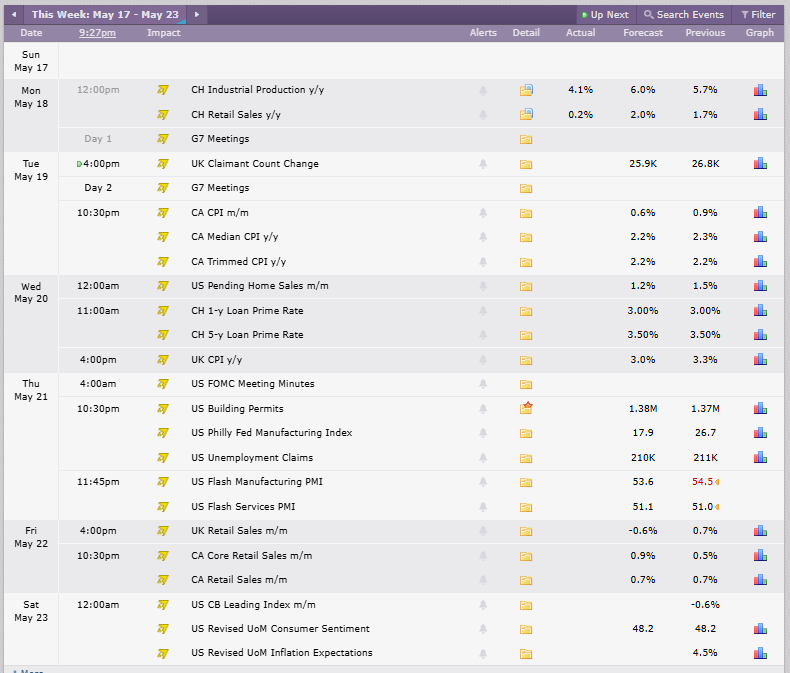
Credit: Crypto Craft
These are the key events to watch because they can directly influence inflation expectations, bond yields, and crypto sentiment. Softer CPI data could help Bitcoin stabilise and rebuild momentum. Hotter CPI data could increase pressure on risk assets and make it harder for BTC to reclaim the $80,000 region.
For now, Bitcoin remains in a recovery phase, but the market has entered a more cautious stage. Buyers need to defend the current support zone and prevent this pullback from turning into a larger rejection from the daily 200 EMA.