
Weekly Bitcoin Price Analysis & Forecasts the 4th May - 10th May 2026
Bitcoin continued to build bullish momentum through the week of 4th May to 10th May 2026, pushing into the low-$80,000 region and showing a much stronger recovery structure than previous weeks. The market is no longer behaving like a simple relief bounce from the February lows. Instead, BTC is showing signs of trend repair, with buyers defending higher levels and price now testing a more important macro resistance zone.
Sentiment has also improved around the upcoming Clarity Act, which could provide a clearer regulatory framework for digital assets. If the market sees genuine progress, this could support institutional confidence and add another bullish driver for Bitcoin.
At the same time, macro risk remains. Oil prices have surged again as the Iran conflict continues to affect supply expectations and shipping risk. Higher oil can keep inflation pressure elevated, which may affect bond yields, Fed expectations, and broader risk appetite. So while the chart is leaning bullish, the market still needs to navigate CPI data, Fed-related headlines, and geopolitical volatility.
Hourly Analysis (1H)
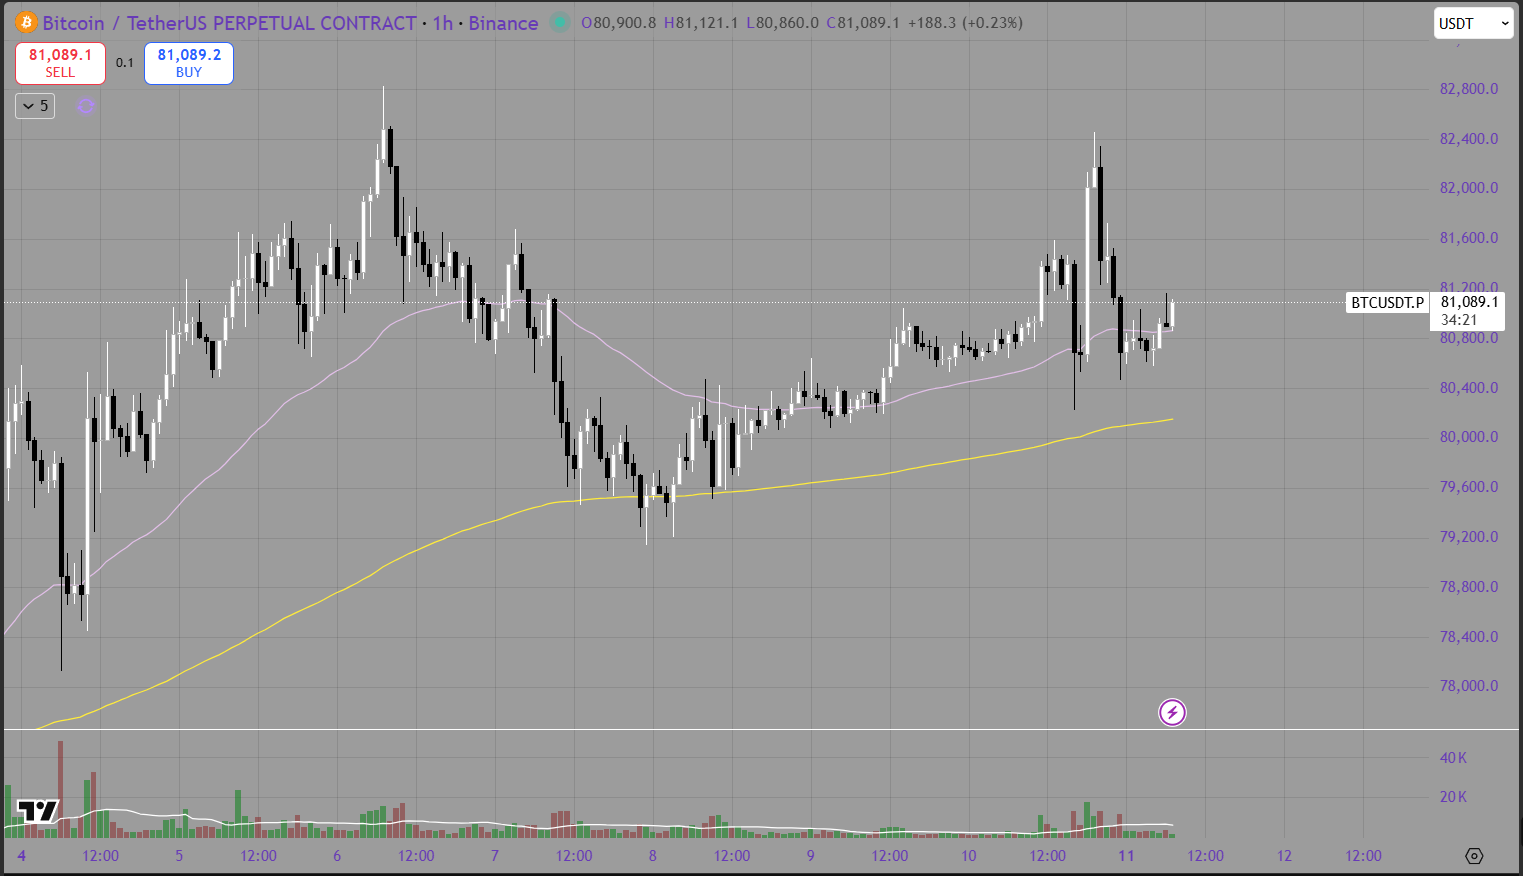
The hourly chart shows a strong short-term structure. Bitcoin started the week around the high-$70,000 region before pushing above $80,000. The key positive is that BTC has continued to hold above both major moving averages, with the purple line acting as the 50 EMA and the yellow line acting as the 200 EMA.
This is a healthy sign. Price trading above both the 50 EMA and 200 EMA shows that short-term momentum has shifted in favour of buyers. Earlier in the year, Bitcoin was constantly trading below these levels and every bounce was being sold. This week looked different.
The strongest move came when BTC pushed into the $82,000 region. However, sellers stepped in at that level and forced a sharp rejection. This does not ruin the structure by itself, as profit-taking is normal after a strong move. What matters is that BTC did not fully break down after the rejection.
Price pulled back toward the $80,000 area and began stabilising around the 50 EMA. This suggests buyers are still active and are trying to build support near the top of the range.
The key short-term area to watch is now around $80,000 to $80,400. If Bitcoin can hold this region, the hourly chart remains constructive and another attempt toward $82,000 is possible. If BTC loses this zone and starts closing back below the 50 EMA, a deeper pullback toward the 200 EMA could come into play.
Daily Analysis (1d)
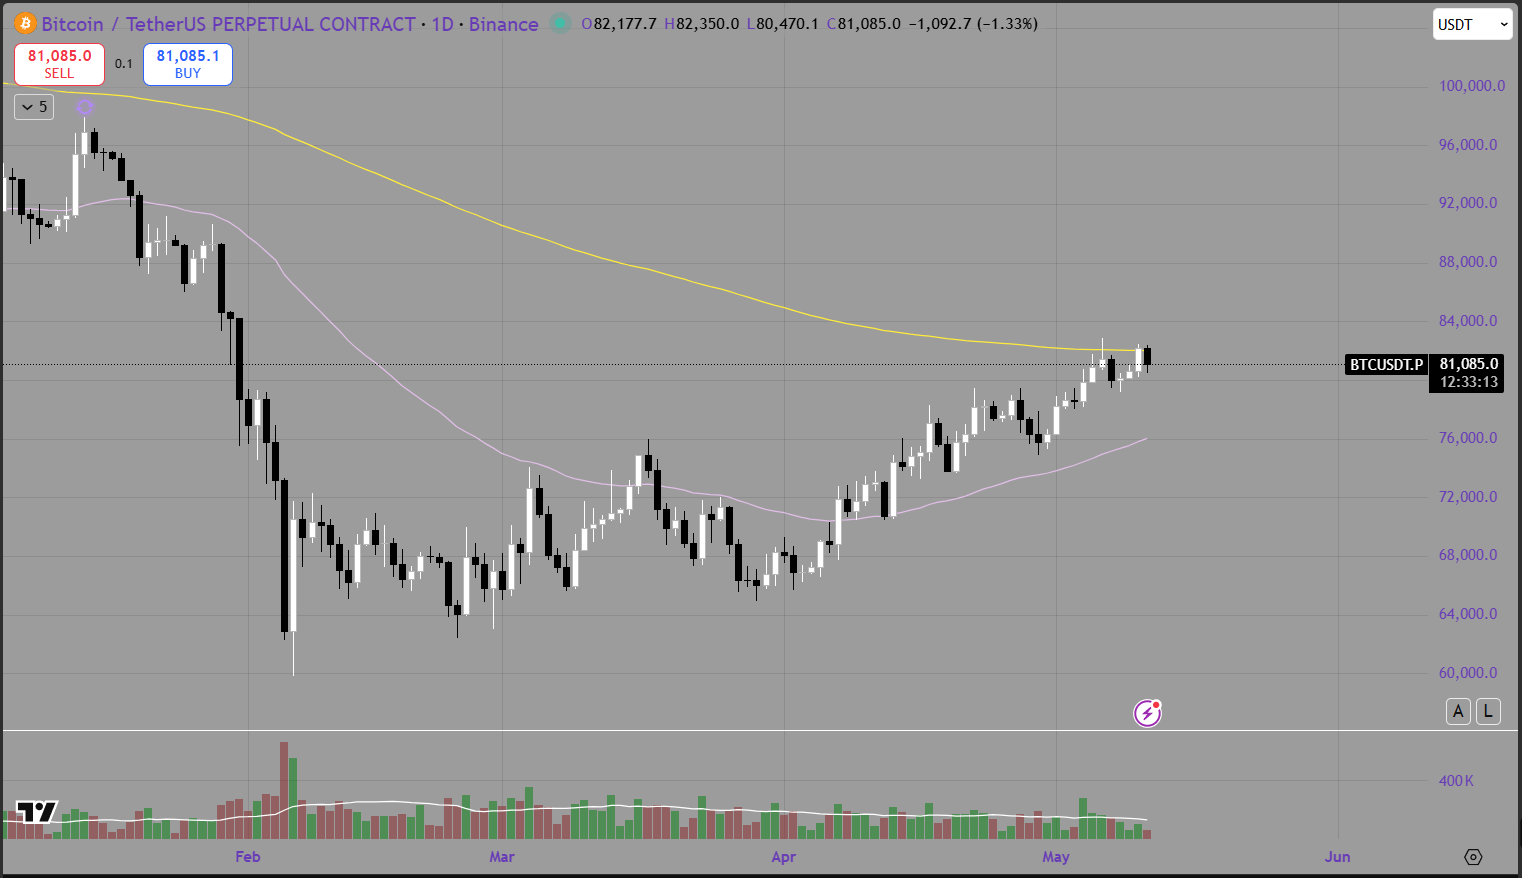
The daily chart shows the larger recovery more clearly. Bitcoin has continued to climb from the February lows and is now pressing into the low-$80,000 region. This is a major improvement compared with the lower consolidation range seen throughout February and March.
The daily 50 EMA, shown by the purple line, is now below price and acting as a broader recovery guide. Reclaiming and holding above this level is an important step in repairing the trend.
The bigger test is the daily 200 EMA, shown by the yellow line. Bitcoin is now approaching this level, but has not yet fully broken and held above it with conviction. This remains the key difference between a recovery and a confirmed broader trend reversal.
A clean reclaim of the daily 200 EMA would be a strong bullish signal. It would suggest BTC is no longer simply bouncing from oversold conditions, but is starting to rebuild a stronger macro structure.
The daily chart is also showing higher lows and stronger demand from the April base. BTC has moved from the mid-$60,000 region into the low-$80,000s without immediately breaking down, which shows buyers are absorbing supply much better than earlier in the year.
The Clarity Act could support this recovery if it continues to progress, as regulatory certainty remains one of the biggest overhangs for crypto. However, oil prices and inflation risk remain key macro threats. If oil continues to rise, markets may price in stickier inflation, which could pressure risk assets.
Summary
Bitcoin had a strong week, continuing its recovery and pushing into the low-$80,000 region. The hourly chart remains constructive, with BTC holding above the 50 EMA and 200 EMA while consolidating near the top of the recent range. The daily chart has also improved, with price trading above the daily 50 EMA and now approaching the daily 200 EMA.
The key technical takeaway is that Bitcoin is starting to look much healthier. The market has moved beyond simple relief-bounce behaviour and is now showing signs of a stronger bullish recovery structure. A clean move above the daily 200 EMA would be an important confirmation signal.
The upcoming Clarity Act discussion is also helping sentiment, as clearer digital asset regulation could support confidence across the crypto market. However, oil remains a major macro risk, with the Iran conflict continuing to create supply concerns and inflation pressure.
Looking ahead, the main red-folder events from the Crypto Craft screenshot are:
US Core CPI m/m
US CPI m/m
US CPI y/y
US Fed Chair Nomination Vote
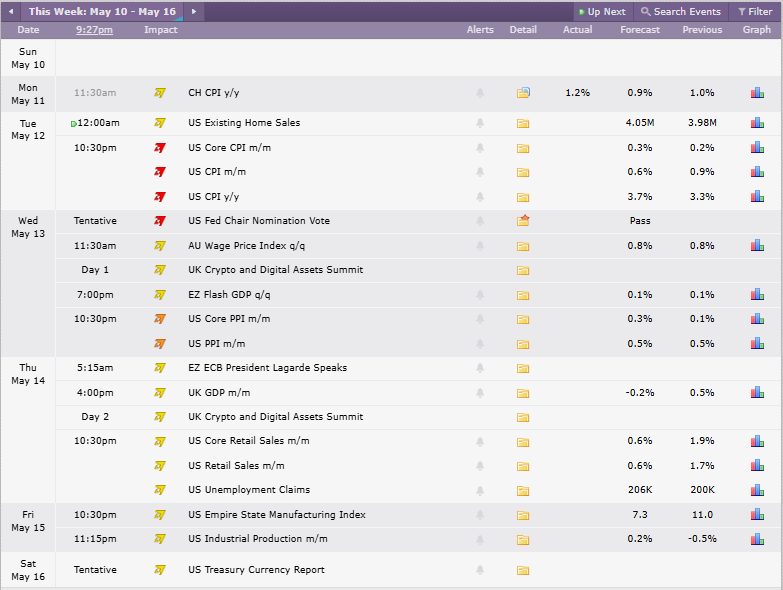
Credit: Crypto Craft
These are the key events to watch because they can directly influence inflation expectations, bond yields, and crypto sentiment. Softer CPI data could support the bullish case and help Bitcoin challenge the daily 200 EMA. Hotter inflation data could create volatility and slow BTC’s attempt to break higher.
For now, Bitcoin remains in a bullish recovery phase. The short-term chart is strong, the daily structure is repairing, and regulatory optimism around the Clarity Act is helping sentiment. The main risk is whether oil-driven inflation pressure or upcoming U.S. CPI data interrupts the momentum.