
Weekly Bitcoin Price Analysis & Forecasts the 20th April - 26th April 2026
Following on from last week’s recovery structure, Bitcoin continued to show strength through the week of 20th April to 26th April 2026, pushing higher from the mid-$70,000 region before stalling near the upper-$70,000s. The broader picture remains constructive compared with the breakdown conditions seen earlier in the year, but BTC is now entering a more important resistance area where buyers need to prove that the move is more than just a relief rally.
The ongoing war in Iran continues to sit in the background as a major macro risk. Oil prices have remained elevated as peace talks between the U.S. and Iran stalled, with Reuters reporting that Brent crude pushed higher as restricted oil shipments through the Strait of Hormuz tightened global supply. That matters for Bitcoin because higher oil prices can feed inflation concerns, which may keep central banks cautious and reduce appetite for higher-risk assets.
This is important heading into the coming week because Bitcoin is now technically improving while macro conditions remain uncertain. The chart is showing healthier momentum, but the market is still exposed to any sudden geopolitical headline, oil spike, or shift in bond yields.
Hourly Analysis (1H)
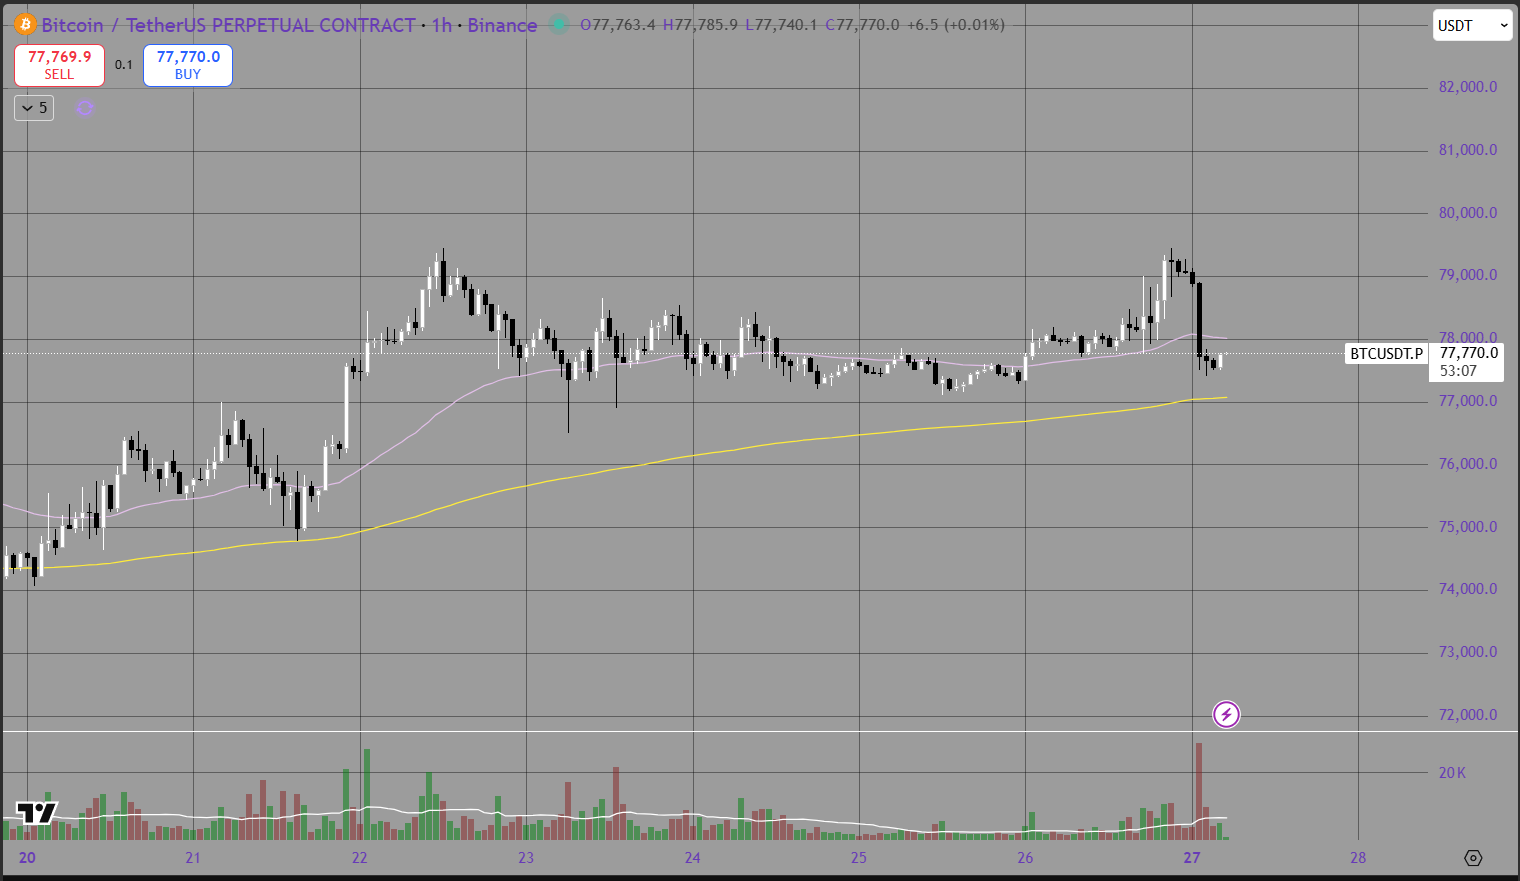
On the hourly chart, Bitcoin’s short-term structure remained mostly constructive throughout the week. Price started around the low-to-mid $74,000 region before grinding higher and eventually pushing toward the $79,000 area. The move was not straight-line bullish, but the overall structure showed higher lows, steady buying pressure, and repeated attempts to hold above key moving averages.
The purple line, which is the 50 EMA, acted as an important short-term guide. For most of the week, Bitcoin traded either above or around this level, showing that buyers were still defending short-term momentum. When price did pull back, it generally respected the 50 EMA area before attempting another push higher.
The yellow line, which is the 200 EMA, remained below price for most of the visible hourly structure. That is a positive sign because it shows Bitcoin is still trading above its broader intraday trend marker. In previous weeks, reclaiming and holding above the 200 EMA was a key sign that the market was trying to shift away from breakdown conditions. This week, that structure continued.
The strongest move came as BTC broke above the $77,000 region and pushed into the $79,000 area. However, that move was met with selling pressure. The rejection from the highs shows that while buyers are active, the market is not yet freely trending. There is still supply sitting above current levels, and traders appear willing to take profit when BTC pushes into the upper end of the range.
After the rejection, price pulled back toward the $77,000 to $78,000 area and began consolidating. This is the key short-term zone to watch. If Bitcoin can hold this area and continue building above the hourly 200 EMA, the structure remains healthy. But if price loses the $77,000 region with momentum, it could suggest that the recent breakout is beginning to weaken.
Overall, the hourly chart shows a market that is still constructive, but slightly tired after a strong move. Bitcoin has not broken down, but it has paused at resistance. The next move depends on whether buyers can defend the current consolidation and push back toward the $79,000 to $80,000 region.
Daily Analysis (1D)
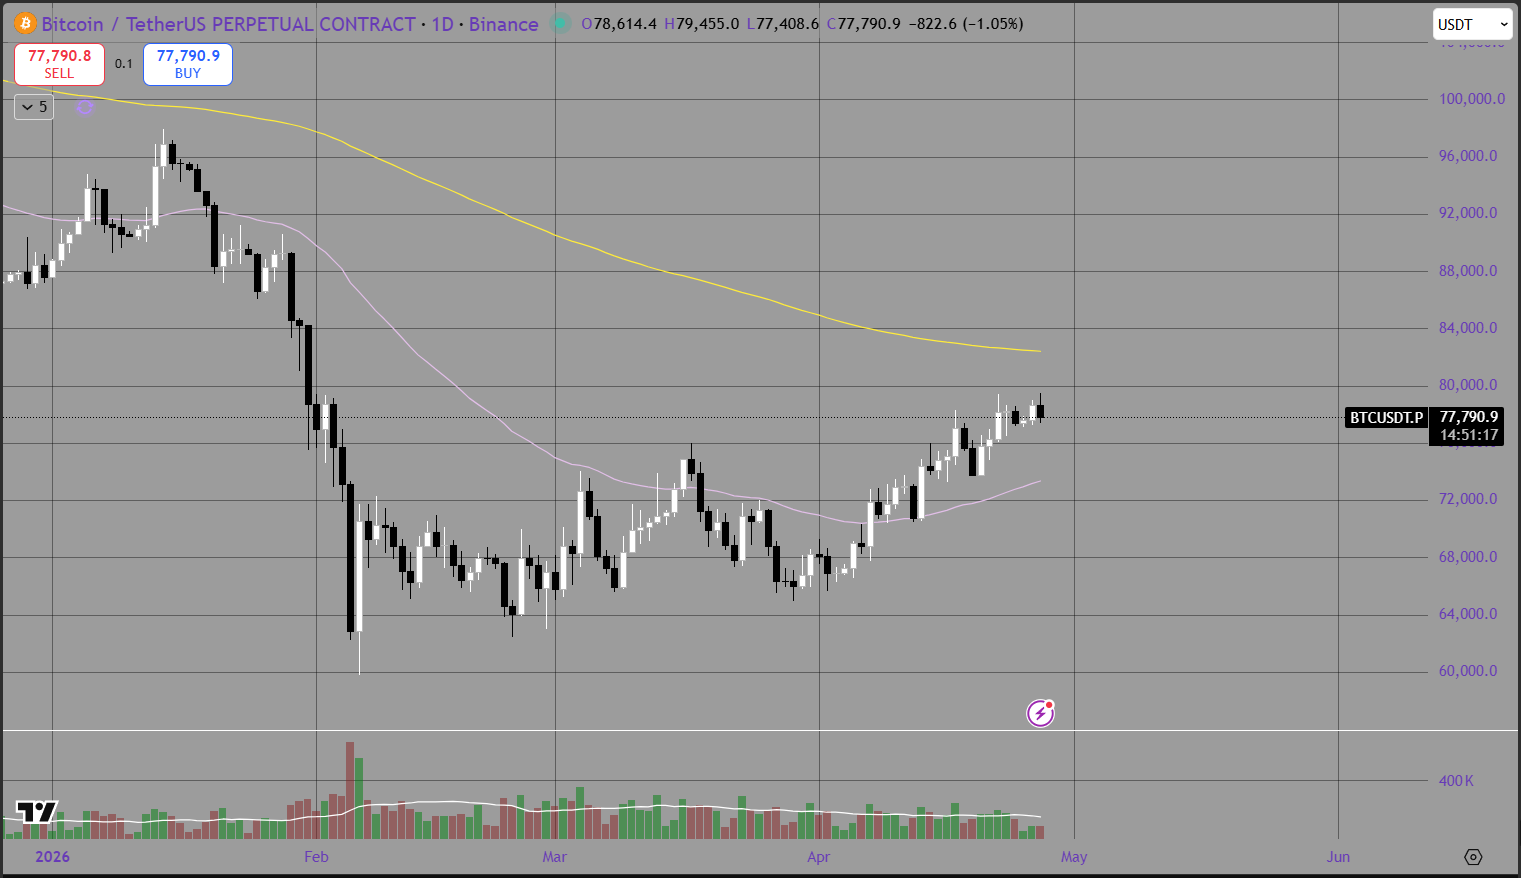
The daily chart shows a more meaningful improvement than we have seen across previous weeks. Bitcoin has continued to recover from the February and March lows and is now trading around the $77,000 to $78,000 area. This is a clear improvement from the lower consolidation range, where BTC was previously struggling to build momentum.
The daily 50 EMA, shown by the purple line, is now below price and beginning to act as a recovery guide. This is important because reclaiming the 50 EMA often marks the first stage of trend repair after a major correction. Bitcoin has now moved beyond that first stage and is trying to establish a higher base.
However, the daily 200 EMA, shown by the yellow line, remains well above current price. This means the broader trend has not fully flipped bullish yet. BTC is improving, but the market is still trading below one of the most important long-term trend indicators. Until Bitcoin can move toward and eventually reclaim the daily 200 EMA, the bigger structure should still be viewed as a recovery phase rather than a confirmed macro reversal.
The daily chart also shows that Bitcoin is approaching a potential resistance zone. The current move has been strong, but price is now pushing into an area where previous breakdown structure may act as supply. This is where the market often needs to pause, consolidate, and prove that buyers are willing to keep supporting higher prices.
Volume also supports the idea of a recovery, but not yet a complete trend reversal. The major capitulation volume from earlier in the year has faded, and recent buying volume has improved, but BTC still needs stronger follow-through to confirm that institutions and larger buyers are stepping back in aggressively.
From a macro perspective, the Iran conflict remains a major risk to watch. Reuters reported that oil prices surged as U.S.-Iran peace talks stalled, with supply concerns tied to the Strait of Hormuz continuing to pressure energy markets. Rising oil prices can keep inflation expectations elevated, while higher bond yields can create pressure across equities and crypto. That means Bitcoin’s recovery is still happening in a fragile macro environment.
The daily chart is improving, but it is not risk-free. The market has shifted from bearish breakdown to recovery, but BTC still needs to prove it can hold higher levels and avoid another lower high beneath the daily 200 EMA.
Summary
Bitcoin had another constructive week, continuing the recovery that began in previous weeks. On the hourly chart, BTC held above the 50 EMA and 200 EMA for most of the week, pushed toward the $79,000 region, and then pulled back into consolidation. This suggests short-term momentum remains positive, but buyers are now being tested near resistance.
On the daily chart, the recovery is clearer. Bitcoin has reclaimed the daily 50 EMA and is trading well above the lower range that dominated earlier in the year. However, the daily 200 EMA remains above price, meaning the larger trend has not fully reversed yet.
The ongoing war in Iran remains a key macro concern. Stalled peace talks and restricted oil flows through the Strait of Hormuz have helped keep oil prices elevated, which adds pressure to inflation expectations and broader risk markets. Reuters reported that oil rose sharply as the conflict continued to disrupt supply, while markets remained sensitive to the risk of a prolonged energy shock.
Looking ahead, the main red-folder events from the Crypto Craft screenshot are:
US Federal Funds Rate
US FOMC Statement
US FOMC Press Conference
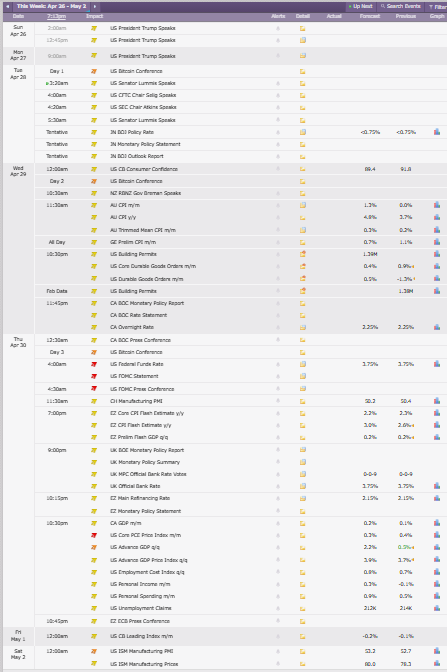
Credit: Crypto Craft
These are the key events to watch because they can directly affect risk appetite. If the Federal Reserve sounds cautious or signals that inflation risks remain elevated, Bitcoin could struggle to continue higher. If the Fed is more balanced and markets interpret the statement as less restrictive, BTC may have room to retest the $79,000 to $80,000 region.
For now, Bitcoin is technically healthier than it was several weeks ago, but the market is entering a more important test. The recovery is real, but confirmation still requires BTC to hold higher support, defend the 50 EMA, and eventually move toward the daily 200 EMA with stronger conviction.