
Weekly Bitcoin Price Analysis & Forecasts13th April - 19th April 2026
Bitcoin spent the week of 13th April to 19th April 2026 continuing its recovery phase, but this was not a simple one-way bullish move. Instead, BTC traded more like a market trying to build acceptance at higher levels after months of corrective price action. The weekly structure improved, yet the move still carried a degree of caution because broader macro conditions remain unstable and highly sensitive to geopolitics.
That macro backdrop continues to be dominated by the ongoing war in Iran. Even though there have been moments where markets tried to price in de-escalation, the conflict has remained a major source of pressure through the energy complex and broader risk sentiment. Reuters reported that renewed fears around the ceasefire, tanker attacks, and shipping disruption through the Strait of Hormuz pushed oil sharply higher again, while global equities pulled back and investors stayed focused on Gulf shipping risks and inflation spillovers.
For Bitcoin, this matters for two reasons. First, stronger oil prices feed inflation concerns, which can make markets less confident about easier central bank policy. Second, when global investors become more defensive, crypto can struggle to fully detach from broader risk-off behaviour. That means BTC can still recover technically, but those recoveries often lose momentum unless the macro environment becomes more supportive.
There is also an extra layer of caution worth noting. Trump’s Truth Social messaging and public threats toward Iran have continued to suggest the conflict may be moving toward another decisive phase rather than calming down. Reuters reported that Trump publicly threatened Iranian infrastructure and also posted about opening the Strait of Hormuz and “taking the oil,” reinforcing the idea that markets remain vulnerable to sudden geopolitical headline risk.
Against that backdrop, Bitcoin’s charts actually held up reasonably well this week. The hourly chart showed resilience and trend repair, while the daily chart continued to show that BTC is trying to carve out a broader recovery base.
Hourly Analysis (1H)
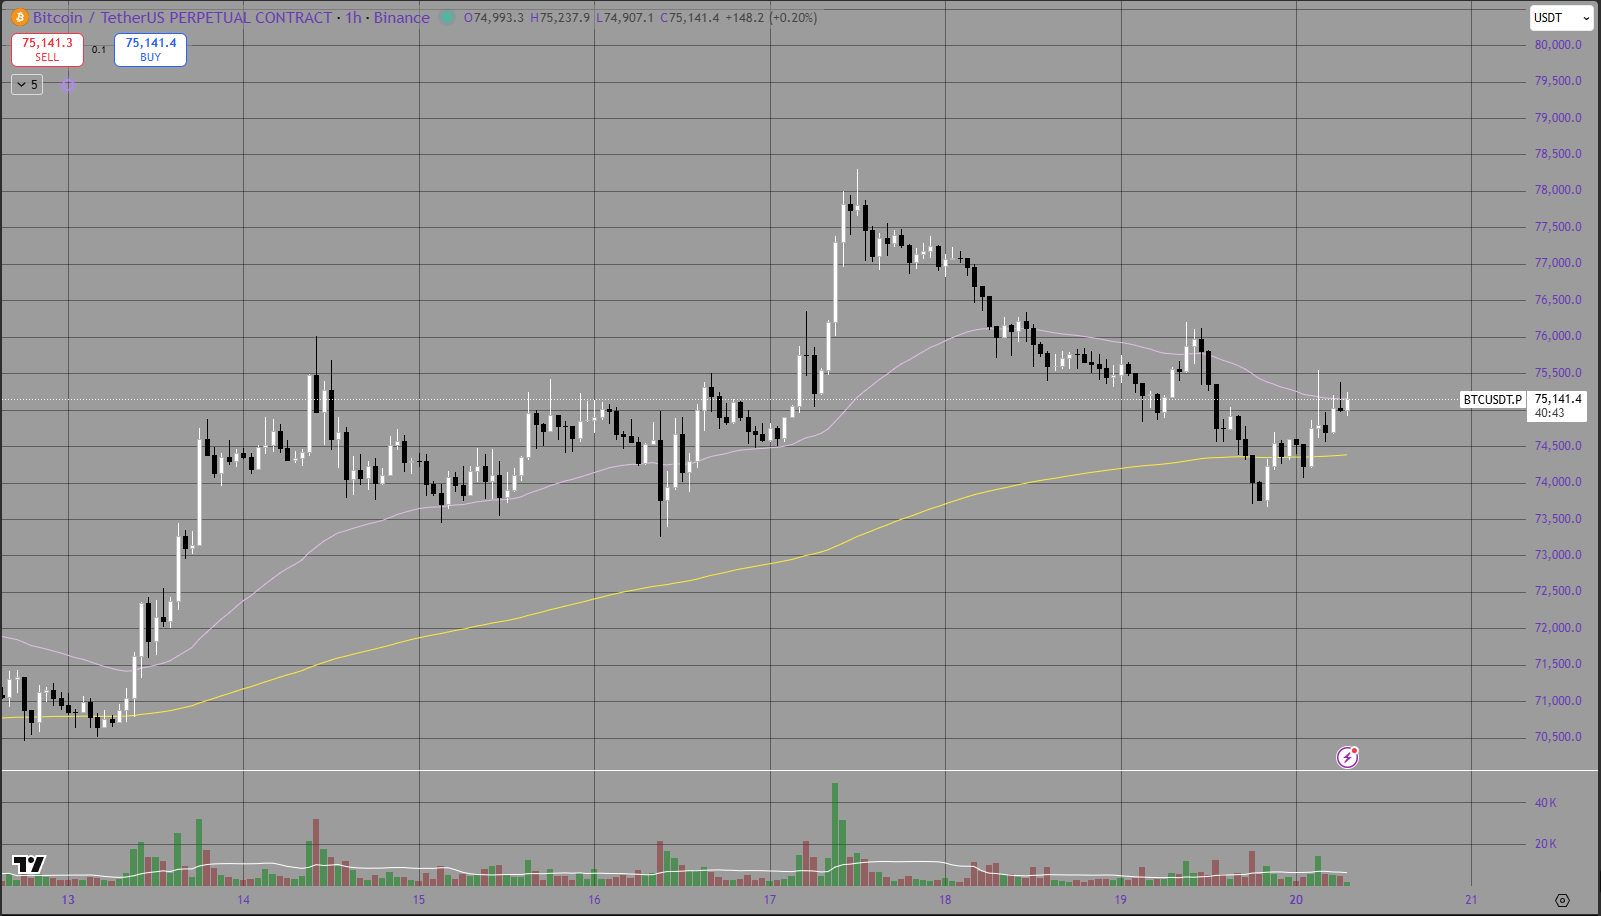
The hourly chart was the clearest sign that Bitcoin’s short-term structure improved over the week. With the thicker grid lines, the price zones are much easier to identify, and the chart showed a gradual shift from range-bound consolidation into a more constructive upward move.
Early in the week, Bitcoin was trading from the low-$71,000 region and quickly built momentum into the mid-$74,000s. That initial advance was strong and orderly, with price holding above the 50 EMA, which is the purple line, while the 200 EMA, shown in yellow, remained beneath price and acted as a broader support guide. When both moving averages are below price and the 50 EMA is sloping upward, that usually reflects improving short-term momentum.
The first half of the week was particularly constructive because BTC did not just spike once and fade. Instead, price spent time consolidating above prior breakout zones, suggesting the market was finding acceptance at higher levels. Buyers repeatedly defended retracements into the purple 50 EMA, which kept the trend healthy.
The most bullish portion of the week came when Bitcoin expanded into the upper-$77,000 region. That move looked like a genuine breakout leg rather than a random short squeeze. Price accelerated cleanly, the 50 EMA remained supportive, and BTC traded comfortably above the hourly 200 EMA. Structurally, this was one of the better hourly sequences seen in recent weeks.
However, once Bitcoin reached that higher zone, the market began to lose momentum. Profit-taking emerged, and the chart shifted from impulsive breakout behaviour into a more measured pullback. What is notable, though, is that the retracement remained relatively controlled. Price did not fully unwind the move. Instead, BTC rotated back toward the mid-$75,000 area, where it found support and stabilised.
Into the back end of the week, Bitcoin pulled back toward the $74,500 to $75,000 region, effectively retesting the area around the hourly 200 EMA. That matters because this zone acted as a structural checkpoint. Rather than collapsing through it, BTC found a bid and bounced modestly. This suggests that the market is still treating that region as an important support band.
So the hourly chart tells a fairly balanced story:
the trend improved,
BTC traded above both the hourly 50 EMA and 200 EMA for much of the week,
buyers successfully drove a breakout into the upper-$77,000s,
but that breakout lost energy and rotated into a controlled pullback.
The important takeaway is that the hourly structure remains constructive as long as Bitcoin can continue to hold the mid-$74,000 area and avoid a clean breakdown back below the hourly 200 EMA. If that support continues to hold, the market still has the framework for another upside attempt.
Daily Analysis (1D)
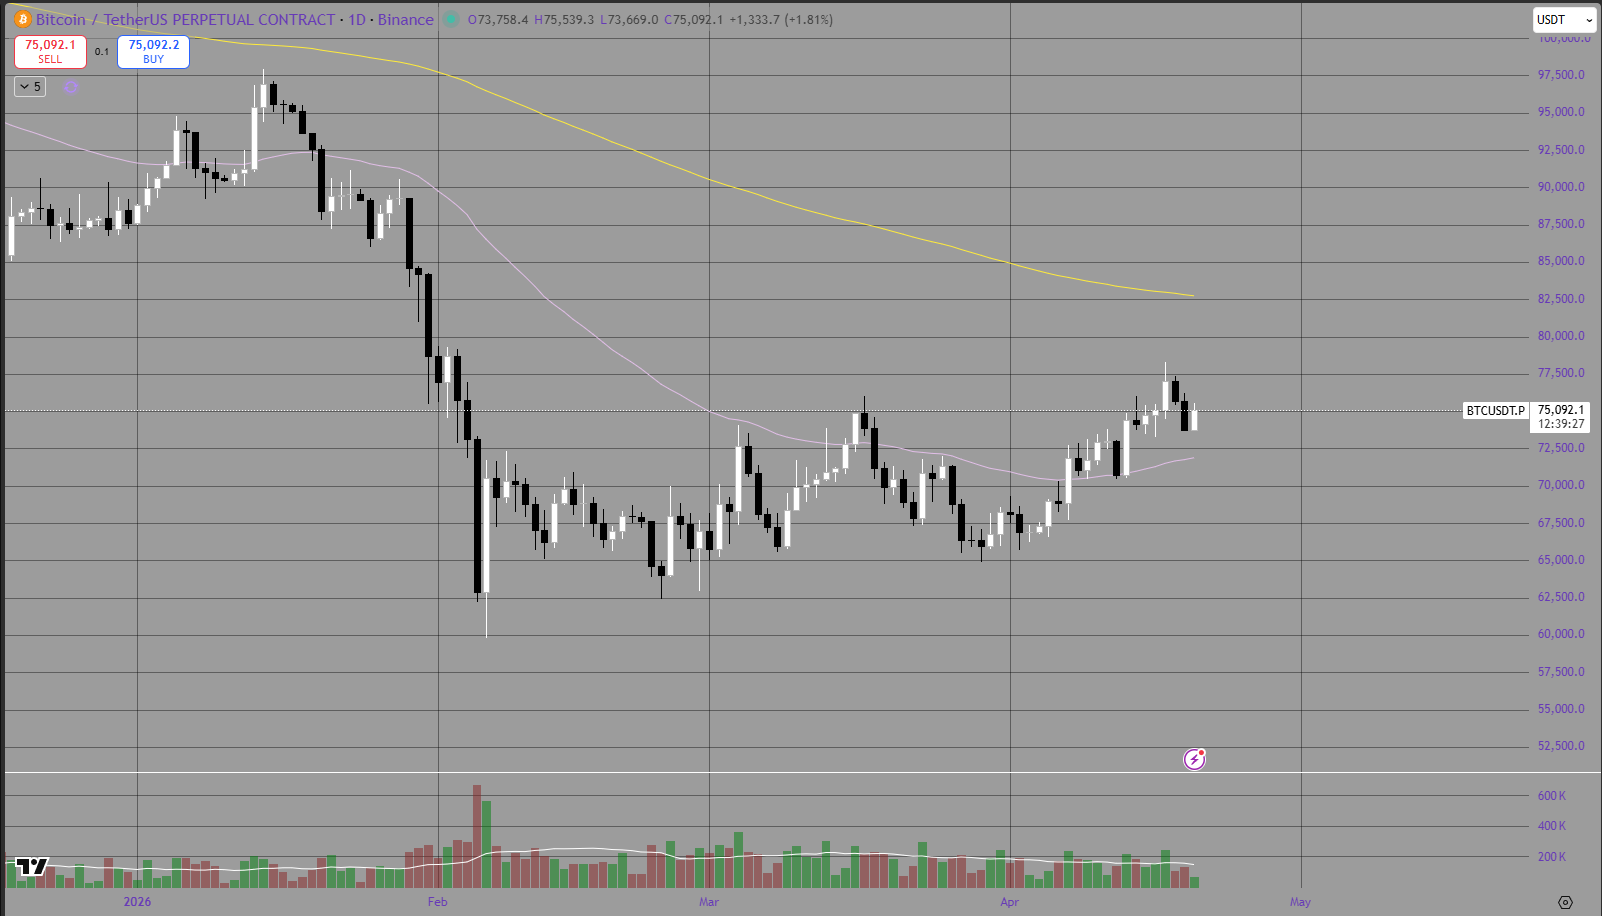
The daily chart remains the more cautious lens, but it also showed genuine improvement this week.
Bitcoin is still trading beneath the daily 200 EMA, which is the yellow line, and that means the broader macro trend has not yet fully turned bullish. The daily 50 EMA, shown in purple, is still the nearer-term trend guide, and price is now trading back above it. That is a constructive development because it signals short-to-medium-term recovery momentum has strengthened.
The bigger picture on the daily is that Bitcoin has transitioned away from panic conditions. The sharp breakdown that dominated February is no longer defining the current market. Instead, price has spent weeks building a more organised recovery structure, and this week added to that repair process.
What stands out most is the move into the mid-$70,000s. That advance shows Bitcoin is no longer trapped only in the lower-end consolidation zone. The market has started testing higher daily territory again, which is exactly what needs to happen if BTC is going to eventually challenge larger overhead resistance.
At the same time, the daily chart still shows limits:
price remains below the daily 200 EMA,
the larger higher-timeframe damage has not yet been fully repaired,
and the latest rally has not yet broken through a major macro resistance zone decisively.
This is why the current structure is best described as recovery, not full reversal.
The macro backdrop helps explain that hesitation. Reuters reported that the Iran conflict continues to disrupt shipping and energy supply expectations, with oil prices rebounding sharply on fears the ceasefire could collapse. Reuters also noted that global markets have remained volatile as investors weigh the risk of supply-related inflation and broader geopolitical escalation.
That has an important knock-on effect for Bitcoin. Higher oil tends to make inflation stickier. Sticky inflation can make central banks less comfortable easing policy quickly. At the same time, defensive flows into bonds and safer assets can drain momentum from higher-beta markets. In that sort of environment, Bitcoin can still rise, but it often struggles to sustain aggressive upside expansion unless there is a strong catalyst.
So, while the daily chart improved materially this week, BTC still needs more follow-through. Reclaiming the daily 50 EMA is a positive step. Reclaiming and holding above the daily 200 EMA would be the much more important signal that the broader structure is truly changing.
Summary
Bitcoin had a constructive week overall. The hourly chart showed a clear improvement in trend structure, with BTC trading above the hourly 50 EMA and 200 EMA for much of the week, breaking toward the upper-$77,000 region, and then pulling back in a relatively controlled fashion. On the daily chart, Bitcoin continued its broader recovery process and managed to hold above the daily 50 EMA, which is encouraging, even though it remains below the daily 200 EMA.
The macro backdrop remains critical. The ongoing war in Iran continues to influence markets through elevated oil prices, shipping disruption concerns, and more defensive investor positioning. Reuters reported that fears over the ceasefire and renewed disruption in the Strait of Hormuz pushed oil sharply higher again, while markets stayed highly sensitive to the risk of further escalation.
There is also reason for continued caution given Trump’s recent public rhetoric. Reuters reported that Trump has threatened Iranian infrastructure and posted about reopening Hormuz by force, which reinforces the view that the war may be moving toward another major decision point rather than fading into the background.
Looking ahead, the main high-impact red-folder events from the Crypto Craft screenshot are:
US Fed Chairman-Designate Warsh Testifies
That is the standout event to watch. If policy rhetoric leans hawkish, risk assets may struggle. If markets interpret the testimony as more balanced or less restrictive, Bitcoin could have room to continue building on this week’s recovery.
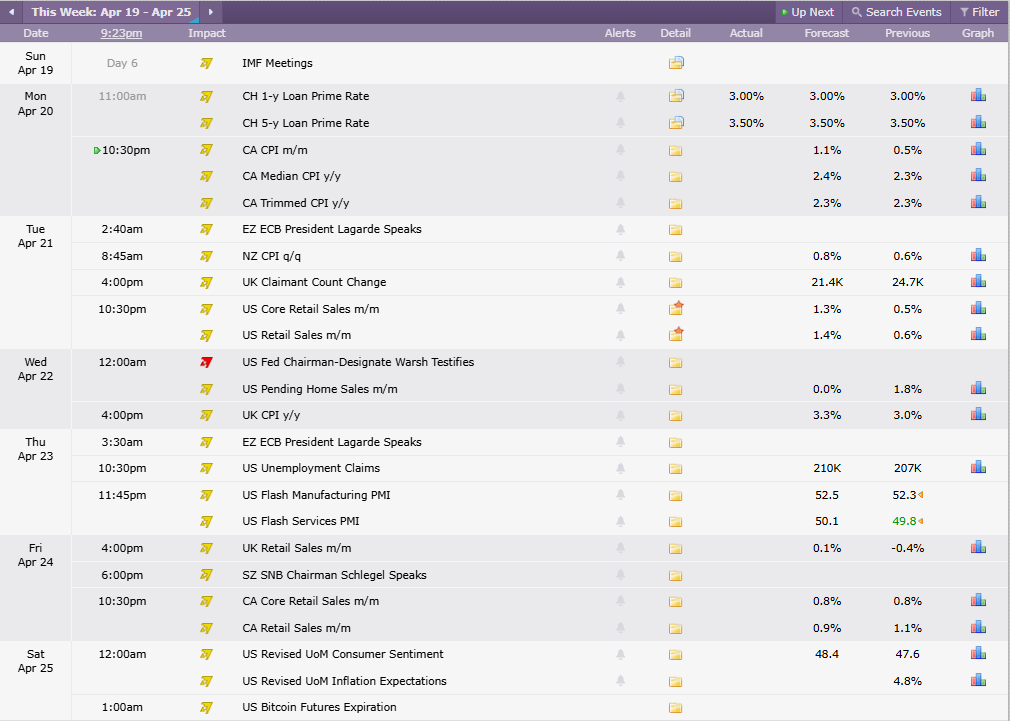
Credit: Crypto Craft
For now, Bitcoin looks technically healthier than it did earlier in the quarter. The hourly chart is constructive, the daily chart is repairing, and buyers are clearly more active. But with oil, bonds, and geopolitical headlines still driving macro sentiment, BTC remains in a market where technical progress can still be interrupted quickly.