
Weekly Bitcoin Price Analysis & Forecasts the 20th July - 26th July 2026
Following on from last week’s constructive recovery toward the $65,000 region, Bitcoin continued to show signs of short-term strength during the week of 20th July to 26th July 2026.
BTC opened the week around the mid-$64,000 area before pushing higher into the $66,000 to $67,000 region. This move showed that buyers were still active after the previous recovery, but price was unable to hold those higher levels. As the week progressed, Bitcoin pulled back and is now trading closer to $65,000.
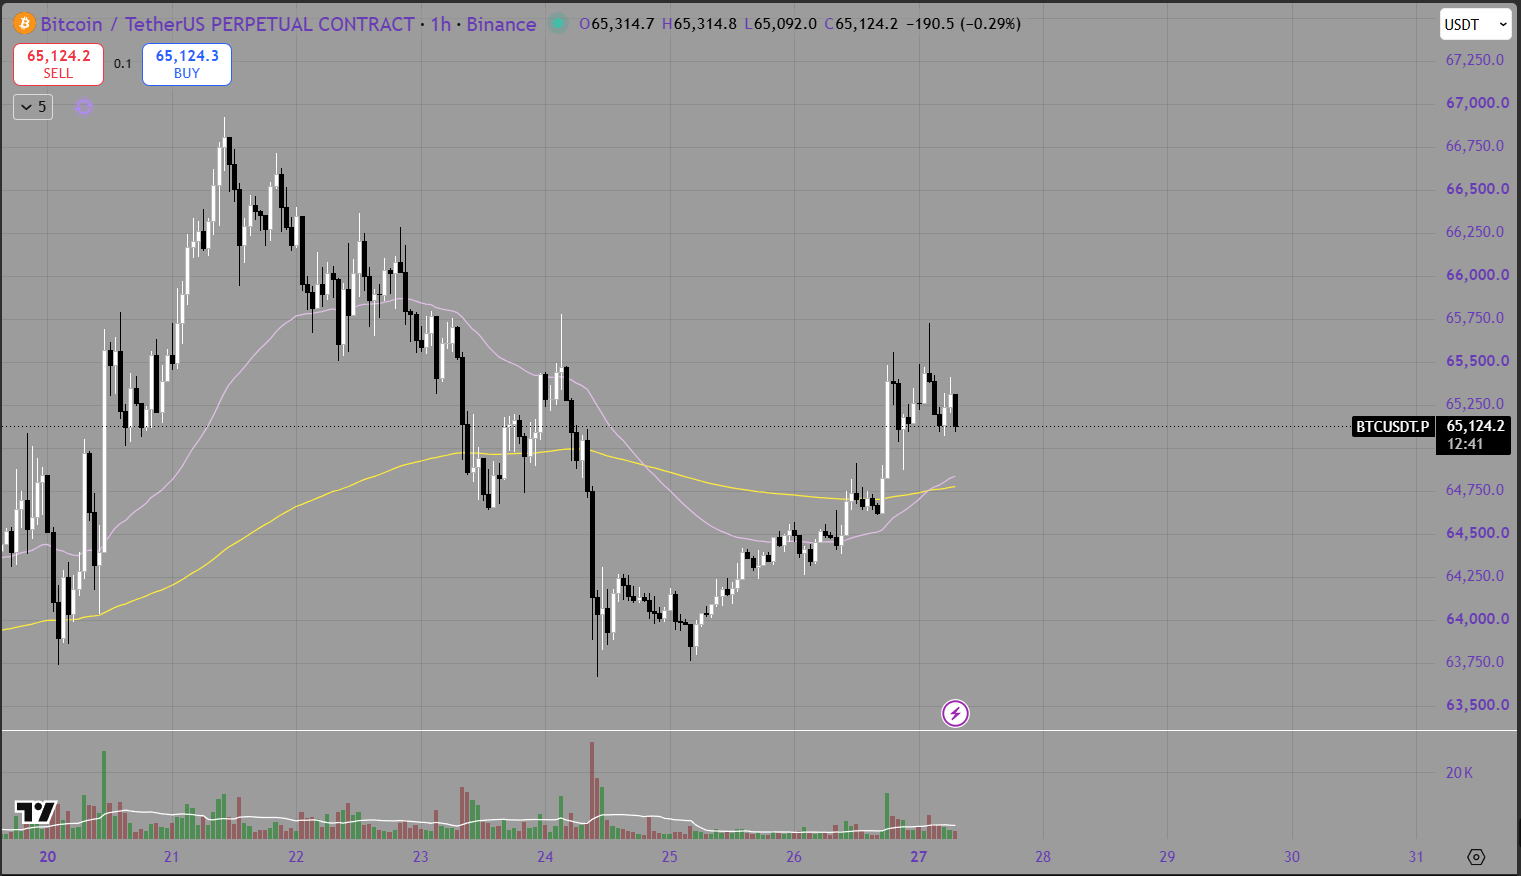
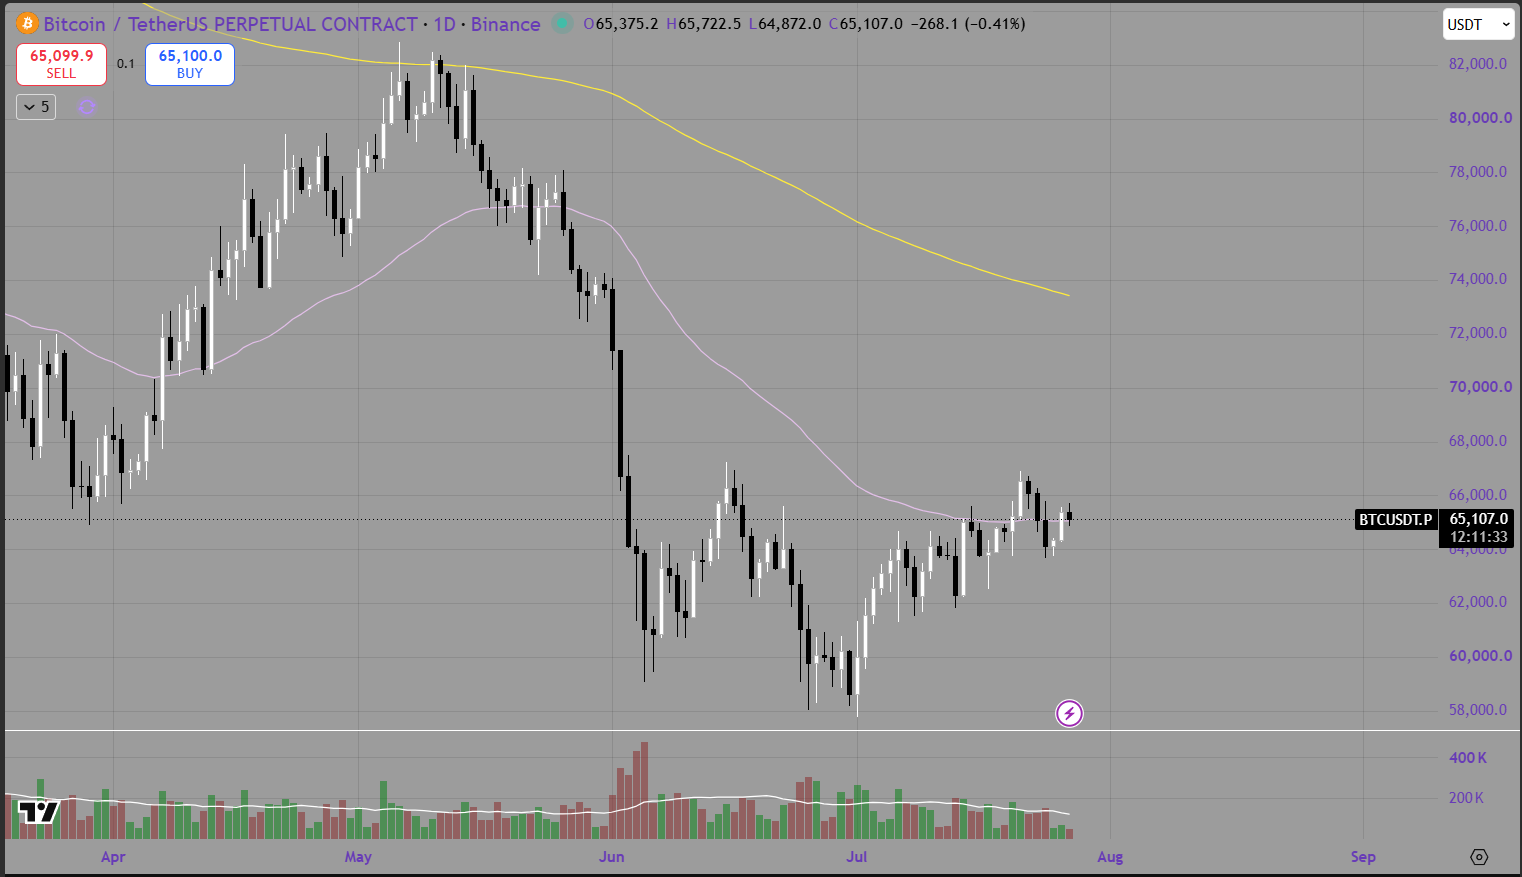
The hourly chart shows a short-term recovery structure that remains intact, although momentum has cooled after the rejection from the weekly highs. The daily chart also shows improvement, with BTC continuing to build from the late-June lows, but price is still below the daily 200 EMA, meaning the broader market has not yet confirmed a full bullish reversal.
The purple line represents the 50 EMA, while the yellow line represents the 200 EMA.
Hourly Analysis
The hourly chart shows Bitcoin beginning the week with strong upside momentum.
BTC pushed from the $64,000 region into the $66,500 to $67,000 area early in the week. This move confirmed that buyers were still defending the short-term recovery and were able to drive price above both the 50 EMA and 200 EMA.
However, the rally became stretched as price moved into the upper-$66,000 region. Bitcoin failed to continue cleanly above $67,000, and sellers stepped in around that zone. This created the first major rejection of the week and began a gradual move lower.
From there, BTC started forming lower highs on the hourly timeframe, eventually pulling back toward the $64,750 to $65,000 region. This area is important because it sits near the hourly moving averages and has acted as a short-term support zone.
The positive sign is that Bitcoin has not fully broken down from the recovery structure. Price remains near the reclaimed EMA zone and is still holding above the lower support created during last week’s breakout. However, the failure to hold above $66,000 shows that buyers still need stronger confirmation.
The immediate support zone is around $64,750 to $65,000. If BTC can continue holding this area, the market may attempt another push toward $65,500, followed by $66,000.
The main resistance is now around $65,500 to $66,000. A clean reclaim of this range would suggest that the recent pullback was only a healthy retracement. Above that, the next major resistance is $66,500 to $67,000.
If Bitcoin loses $64,750, the next support zone sits around $64,000. A deeper move below that would weaken the hourly structure and could bring $63,500 back into focus.
For now, the hourly chart remains cautiously constructive, but buyers need to defend the $65,000 area and reclaim $66,000 to regain momentum.
Daily Analysis
The daily chart shows Bitcoin continuing to recover from the sharp June sell-off.
BTC previously fell from the low-$80,000 region into the high-$50,000 area before building a base through late June and early July. Since then, price has gradually recovered into the mid-$60,000 region, showing that buyers are attempting to regain control.
This week’s move toward $65,000 to $66,000 is a positive development because it shows Bitcoin is still building higher from the recent lows. The daily 50 EMA, represented by the purple line, is now close to price and remains the first major resistance area. A sustained daily close above the 50 EMA would be an important step toward confirming a stronger recovery.
The yellow 200 EMA remains higher, around the mid-$70,000 region. This is still the larger resistance level that Bitcoin must eventually reclaim before the broader trend can shift more confidently bullish.
The current daily structure suggests BTC is attempting to form a rounded recovery from the $58,000 to $60,000 demand zone. This is encouraging, but the market remains in a transition phase. Bitcoin has improved from the lows, but it has not yet broken through the larger resistance zone between $66,000 and $68,000.
The key support remains around $63,500 to $64,000. If BTC holds above this region, the recovery structure remains intact. If that level breaks, the market may revisit $62,000 to $63,000.
The main upside level is now $66,000 to $67,000. A strong daily close above this zone would suggest that buyers are beginning to reclaim control and could open the door toward $68,000 to $70,000.
Until then, the daily chart remains cautiously bullish in the short term, but still not fully confirmed on the broader trend.
Summary
Bitcoin had a constructive but mixed week. Price pushed higher from the mid-$64,000 region into the upper-$66,000 area before rejecting and pulling back toward $65,000.
The hourly chart shows that BTC is still holding near key moving averages, but the rejection from $66,500 to $67,000 shows that buyers have not yet fully broken through resistance. The $64,750 to $65,000 area is now the key short-term support zone to defend.
The daily chart continues to improve from the June lows, with Bitcoin attempting to reclaim the daily 50 EMA. However, the broader trend remains incomplete while BTC trades below the daily 200 EMA.
Key levels to monitor this week include:
Immediate resistance: $65,500 to $66,000
Higher resistance: $66,500 to $67,000
Upside target: $68,000 to $70,000
Initial support: $64,750 to $65,000
Key support: $63,500 to $64,000
Broader support: $62,000 to $63,000
Looking ahead, the main red-folder events from the Crypto Craft calendar are:
US Federal Funds Rate
US FOMC Statement
US FOMC Press Conference
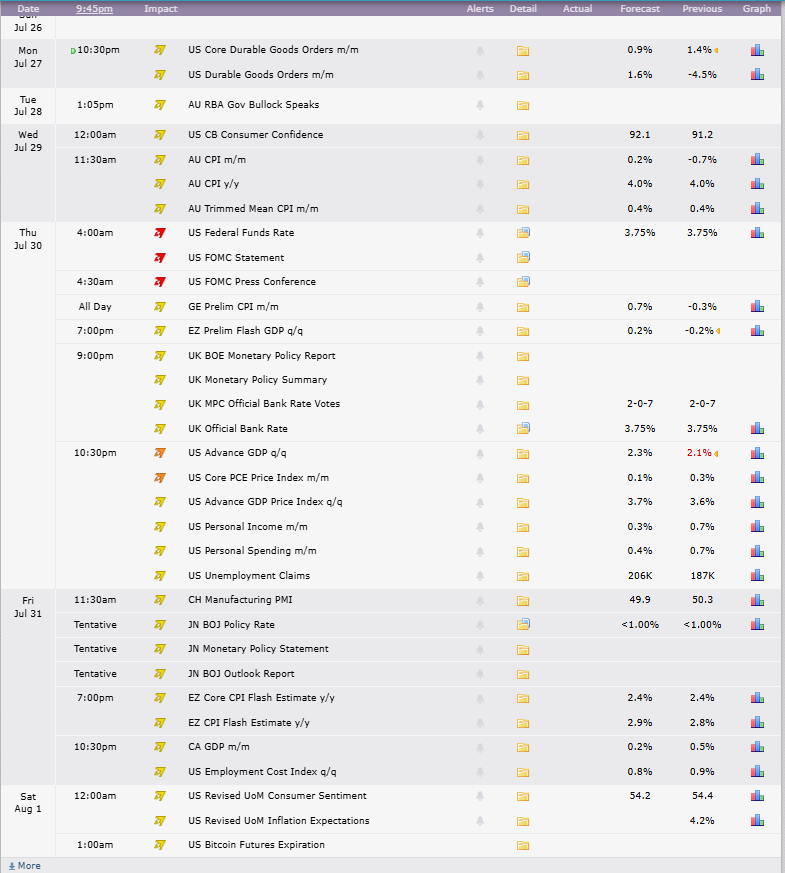
Credit: Crypto Craft
These events are likely to be the biggest scheduled drivers of volatility for Bitcoin and broader risk markets. The rate itself is forecast to remain unchanged at 3.75%, so the market reaction may depend more on the FOMC statement and press conference.
If the Federal Reserve signals a more cautious or dovish outlook, Bitcoin may benefit from improved risk sentiment and lower pressure from bond yields. If the Fed remains firm on inflation or signals tighter conditions for longer, BTC could face renewed selling pressure.
For now, Bitcoin is showing improving structure, but it is approaching an important test. A reclaim of $66,000 to $67,000 would strengthen the recovery and improve the bullish case. A loss of $64,750 would suggest momentum is fading and could bring a deeper pullback into play.
