
Weekly Bitcoin Price Analysis & Forecasts the 27th July - 2nd August 2026
Following on from last week’s rejection near the upper-$66,000 region, Bitcoin remained under pressure during the week of 27th July to 2nd August 2026.
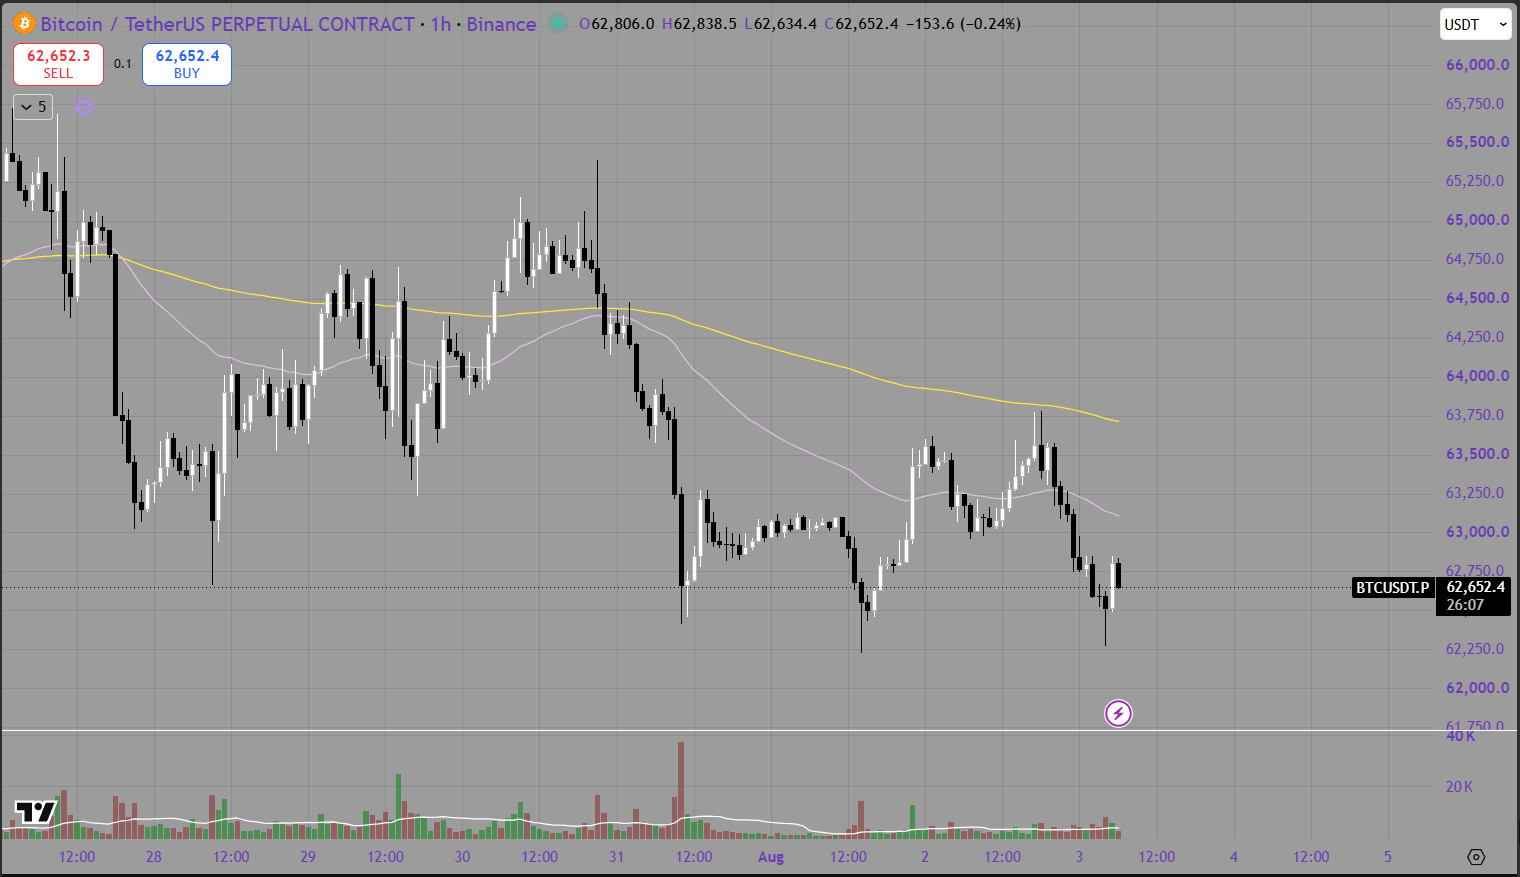
BTC began the week around the mid-$64,000 region but failed to regain momentum. Sellers pushed price below the hourly 50 EMA and 200 EMA, eventually driving Bitcoin into the low-$62,000 area.
The purple line represents the 50 EMA, while the yellow line represents the 200 EMA.
Hourly Analysis
The hourly chart shows a clear sequence of lower highs and lower lows.
Bitcoin repeatedly failed to reclaim the $64,000 to $65,000 region before breaking below both major moving averages. Recovery attempts toward $63,500 were rejected, and price eventually moved into the $62,250 to $62,500 support zone.
BTC is now trading near $62,650, but the bounce remains limited. The first resistance sits around $62,900 to $63,100, followed by stronger resistance near $63,250 to $63,500.
The hourly 200 EMA remains around $63,700 to $63,900. Reclaiming this area would be an important step toward improving the short-term structure.
On the downside, $62,250 to $62,500 remains the first support zone. A break below it could expose $62,000, followed by $61,500 to $61,750.
Daily Analysis
The daily chart remains cautious.
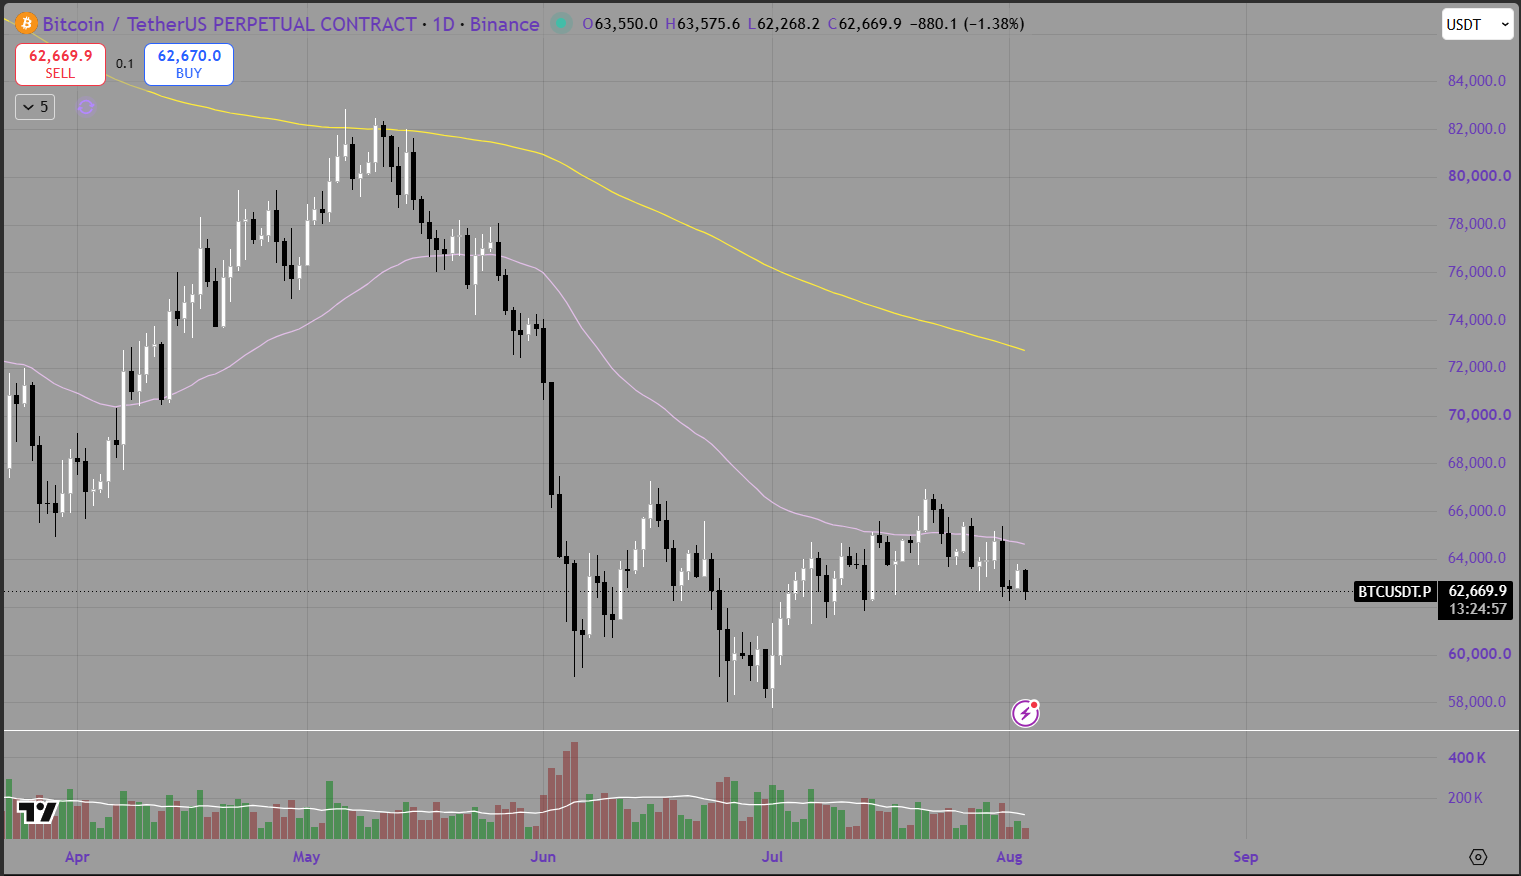
Bitcoin’s recovery from the June low near $58,000 stalled below the daily 50 EMA, and price has since pulled back toward the low-$62,000 region. The declining 50 EMA remains the first major resistance around the mid-$64,000 area.
The daily 200 EMA remains much higher near the low-$70,000 region, confirming that the broader trend is still under pressure.
The current daily structure places Bitcoin between major support around $58,000 to $60,000 and resistance near $64,000 to $66,000. A move back above $64,000 would improve the outlook, while a break below $60,000 would significantly weaken the structure.
Summary
Bitcoin had another weak week, falling from the mid-$64,000 region into the low-$62,000 area.
The hourly chart remains bearish below both major EMAs, while the daily chart continues to trade beneath the declining 50 EMA and 200 EMA.
Key levels to watch include:
Immediate resistance: $62,900 to $63,100
Higher resistance: $63,250 to $63,500
Major resistance: $64,500 to $66,000
Initial support: $62,250 to $62,500
Lower support: $61,500 to $62,000
Major support: $58,000 to $60,000
The main red-folder events on the Crypto Craft calendar are:
US Average Hourly Earnings m/m
US Non-Farm Employment Change
US Unemployment Rate
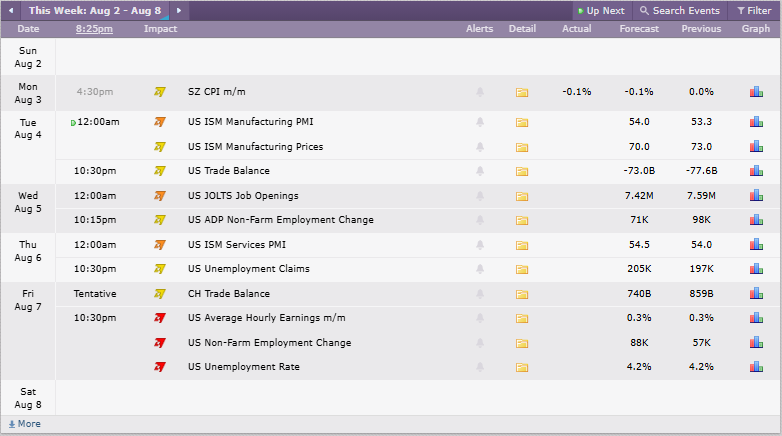
Credit: Crypto Craft
These labour-market releases could create significant volatility across Bitcoin and broader risk assets. Stronger data may support higher bond yields and tighter policy expectations, while weaker figures could improve expectations for easier financial conditions.
For now, sellers retain the advantage while Bitcoin remains below $63,500 to $64,000. A decisive break below $62,000 could bring $60,000 back into focus.
