
Weekly Bitcoin Price Analysis & Forecasts the 21st April - 3rd May 2026
Bitcoin continued to build on its recent recovery through the period of 21st April to 3rd May 2026, with price pushing higher into the upper-$70,000 region before stalling near short-term resistance. Compared with the aggressive downside structure seen earlier in the year, BTC is now clearly trading with better momentum. However, the market is still not fully out of danger, as the broader daily chart remains in a recovery phase rather than a confirmed macro reversal.
The hourly chart shows Bitcoin holding above both key moving averages for most of the move, with the purple line acting as the 50 EMA and the yellow line acting as the 200 EMA. This gives the short-term structure a healthier look. The daily chart is also improving, with BTC reclaiming the daily 50 EMA, but the daily 200 EMA still sits above price, meaning the larger trend has not fully flipped bullish yet.
Macro conditions remain a major risk factor. Oil prices have surged again as the Iran conflict continues to affect shipping and supply through the Strait of Hormuz. Reuters reported that oil jumped more than 3% after Iran claimed it attacked a U.S. warship, while the U.S. denied the report; Brent crude was reported around $111.81 and WTI around $105.34 amid continued disruption concerns. Reuters also reported earlier that global oil prices briefly hit a four-year high above $126 on concerns that the U.S.-Iran war could worsen and create a prolonged Middle East supply disruption.
That matters for Bitcoin because higher oil prices can feed inflation expectations, which then impacts bond yields, central bank expectations, and risk appetite. When inflation pressure rises, markets often become more cautious toward speculative assets like crypto, even when the chart structure is improving.
Hourly Analysis (1H)
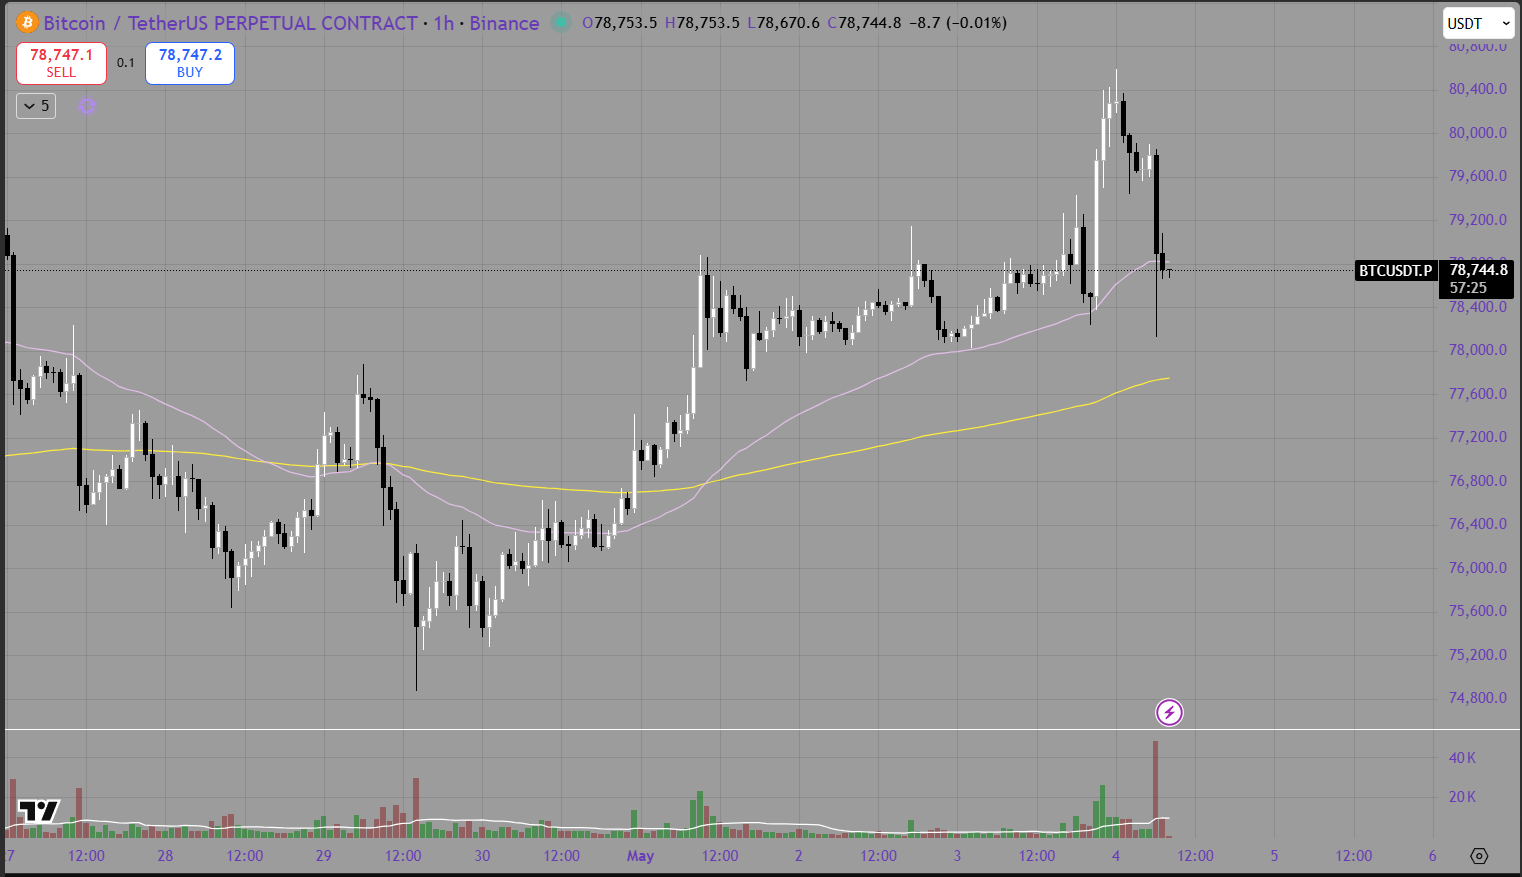
The hourly chart shows a fairly constructive structure across the period. Bitcoin started the visible range around the mid-$70,000 area before gradually pushing higher, consolidating, and then attempting another breakout into the $79,000 to $80,000 region.
The key positive on the hourly chart is that BTC held above the 200 EMA, shown by the yellow line, for most of the move. This is important because the 200 EMA often acts as the broader intraday trend guide. When price is above it and the moving average is rising, the short-term market structure is generally healthier.
The 50 EMA, shown by the purple line, also played an important role. During the early and middle part of the move, BTC repeatedly used the 50 EMA as dynamic support. Price pushed higher, consolidated, pulled back toward the purple line, and then continued higher again. That is usually a sign of controlled trend development rather than random volatility.
The strongest section of the hourly chart came when Bitcoin broke above the $78,000 zone and pushed into the $80,000 region. This was a meaningful attempt to expand higher and showed that buyers were still active. However, once price reached that upper area, the market rejected sharply. That rejection is important because it shows that sellers are still waiting at higher levels and that Bitcoin has not yet earned clean acceptance above $80,000.
After the rejection, BTC pulled back toward the $78,000 area and briefly wicked lower before stabilising. This is where the chart becomes more balanced. The pullback did not completely destroy the structure, but it did show that the market is still sensitive near resistance. Price is now sitting close to the 50 EMA, and the next reaction from this area matters.
If BTC can hold above the $77,000 to $78,000 zone, the hourly chart remains constructive. That would suggest the rejection was more of a liquidity sweep or profit-taking event rather than a full trend failure. But if price loses that zone and begins closing back below the hourly 200 EMA, the structure would weaken quickly and could open the door for a deeper pullback toward the mid-$75,000 region.
Overall, the hourly chart remains bullish-leaning, but not cleanly bullish. The trend improved, the moving averages are supportive, and price made a higher high, but the rejection from the $80,000 region shows that Bitcoin is now testing a more serious resistance area.
Daily Analysis (1D)
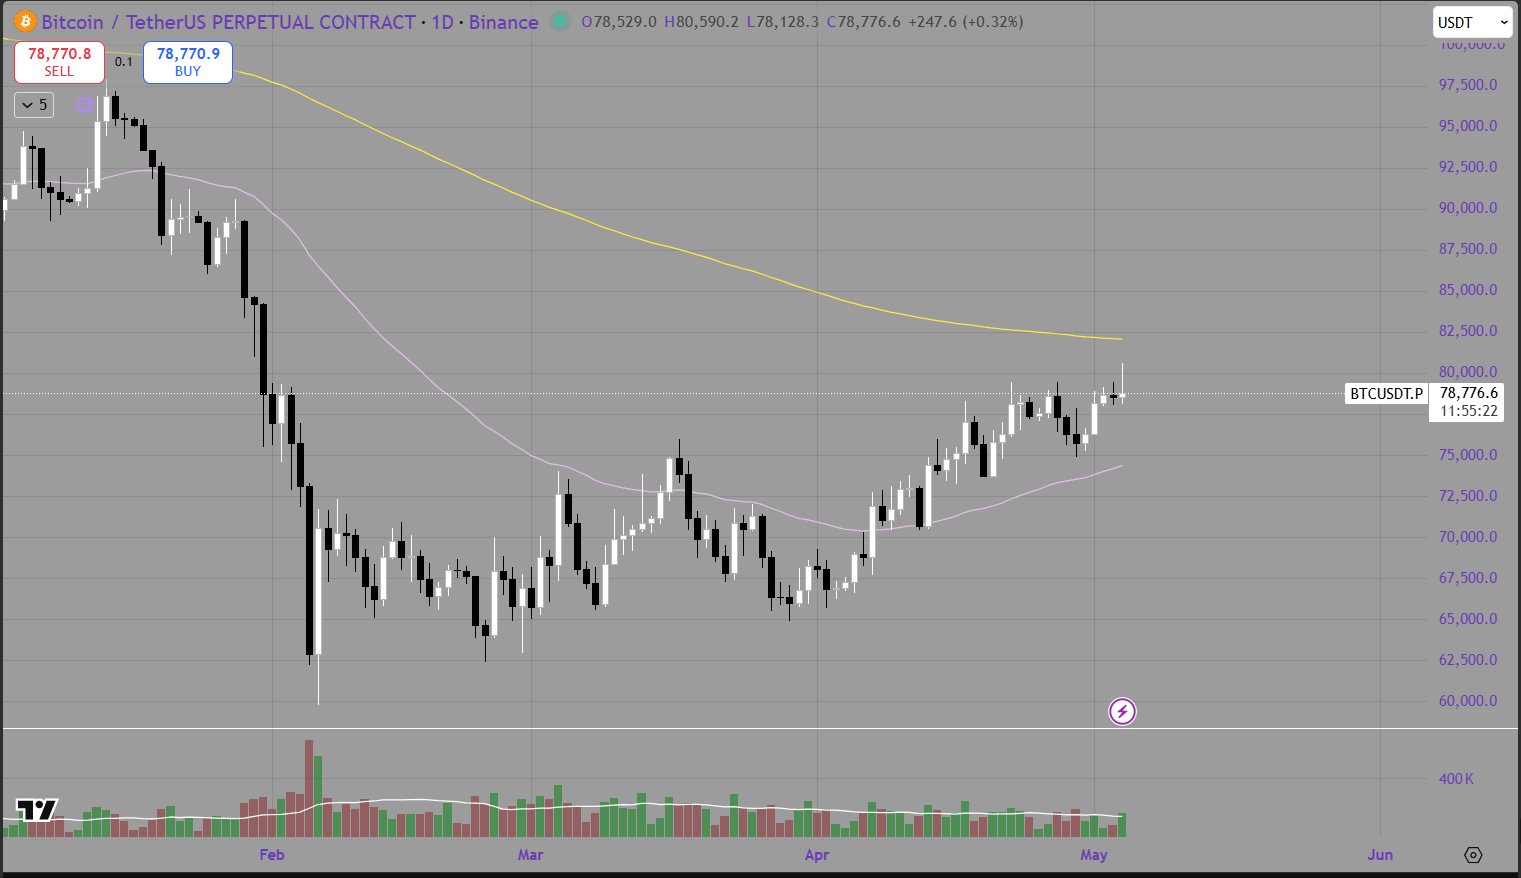
The daily chart gives a broader and slightly more cautious picture. Bitcoin has continued to recover strongly from the February lows, moving from the lower-$60,000 region into the upper-$70,000s. That is a major improvement in structure and shows that buyers have been willing to step in after the heavy liquidation phase earlier in the year.
The most important development is that BTC is now trading above the daily 50 EMA, shown by the purple line. This is a positive sign because the 50 EMA often acts as the first major trend-repair level after a deep correction. When price reclaims this area and holds above it, it suggests the market is no longer in the same aggressive breakdown mode.
However, the daily 200 EMA, shown by the yellow line, remains above current price. This is still the major issue for the bulls. Until Bitcoin can move toward and eventually reclaim the daily 200 EMA, the broader trend should still be treated as a recovery inside a larger corrective structure rather than a confirmed long-term reversal.
The daily chart also shows BTC moving into a potential resistance band. Price has pushed strongly from the lows, but it is now approaching areas where sellers previously took control. This is where recoveries often slow down. The market needs time to consolidate, build support, and prove that buyers can absorb supply.
Volume has been steady, but not explosive enough to suggest full capitulation reversal. The strongest volume came during the earlier breakdown and recovery phase. Current buying is constructive, but Bitcoin still needs a stronger daily close above the upper-$79,000 to $80,000 region to confirm that the next leg higher is opening.
The oil and macro backdrop add another layer of risk. Reuters reported that physical oil markets have been distorted by the Iran war, with disruptions around Hormuz creating a major geopolitical risk premium and forcing investors to price in supply uncertainty. Reuters also noted that inflation concerns tied to the war and energy prices have affected broader markets, with investors shifting toward commodities and watching central bank policy closely.
For Bitcoin, this creates a mixed setup. On one hand, BTC is technically improving. On the other hand, rising oil prices and elevated bond yields can reduce risk appetite and make it harder for crypto to sustain a clean breakout. This means the daily chart is improving, but the macro environment is still not fully supportive.
Summary
Bitcoin had another constructive period, with the market continuing to recover from the earlier year sell-off. The hourly chart shows BTC trading above both the 50 EMA and 200 EMA for most of the move, pushing into the $80,000 region before rejecting and consolidating near $78,000. The daily chart also improved, with price reclaiming the daily 50 EMA, but the daily 200 EMA remains above price and still acts as the larger trend barrier.
The key technical takeaway is that Bitcoin is no longer behaving like a market in freefall. It is now building a recovery structure. However, the market has not yet confirmed a full macro reversal. A sustained move above $80,000 would be constructive, while a loss of the $77,000 to $78,000 region could weaken the short-term setup.
The surge in oil prices remains a major macro factor. The Iran conflict continues to affect supply expectations, shipping routes, and inflation sentiment. Higher oil prices can keep inflation sticky, support higher bond yields, and pressure risk assets such as Bitcoin.
Looking ahead, the main red-folder events from the Crypto Craft screenshot are:
US ISM Services PMI
US Average Hourly Earnings m/m
US Non-Farm Employment Change
US Unemployment Rate
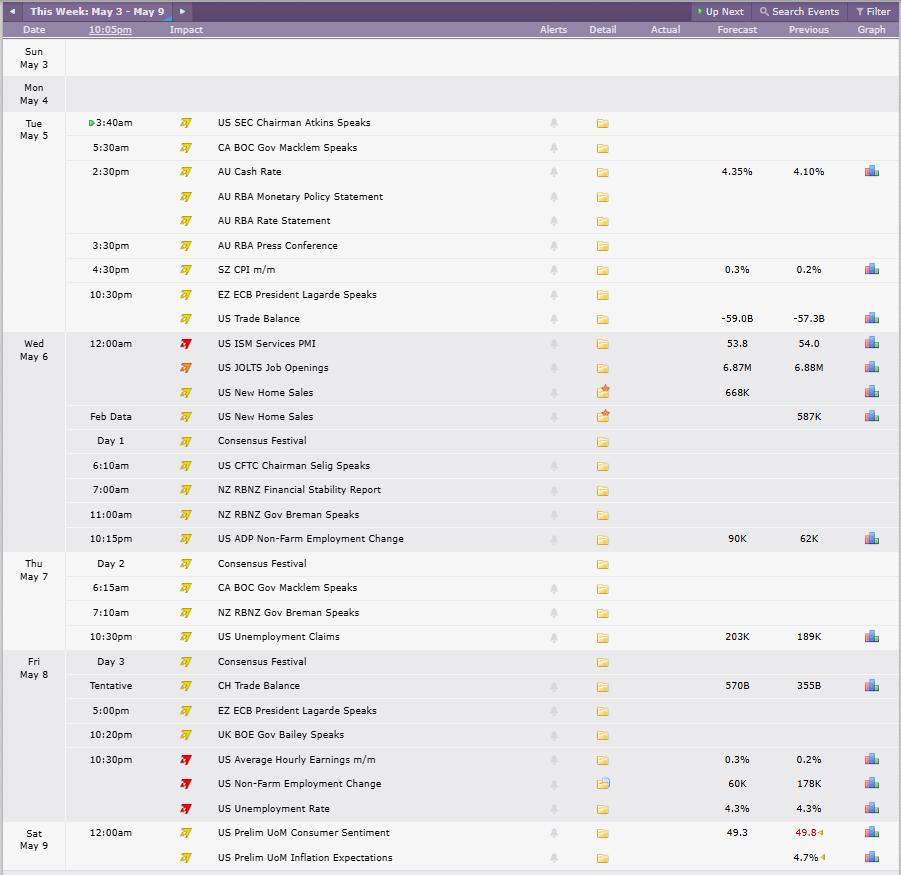
Credit: Crypto Craft
These are the key events to watch because they can directly influence inflation expectations, bond yields, and Federal Reserve policy expectations. Stronger-than-expected services or labour data may pressure Bitcoin if markets interpret it as reducing the likelihood of easier monetary policy. Softer data may support risk appetite, but only if it does not trigger broader recession concerns.
For now, Bitcoin remains in a recovery phase with improving momentum. The short-term chart is constructive, the daily chart is repairing, and buyers are clearly more active than they were during the breakdown. But with oil shocks, Iran war headlines, bond-market pressure, and upcoming U.S. labour data still in play, caution remains important.