
Weekly Bitcoin Price Analysis & Forecasts the 6th July - 12th July 2026
Following on from last week’s recovery attempt, Bitcoin spent the week of 6th July to 12th July 2026 consolidating around the low-$60,000 region.
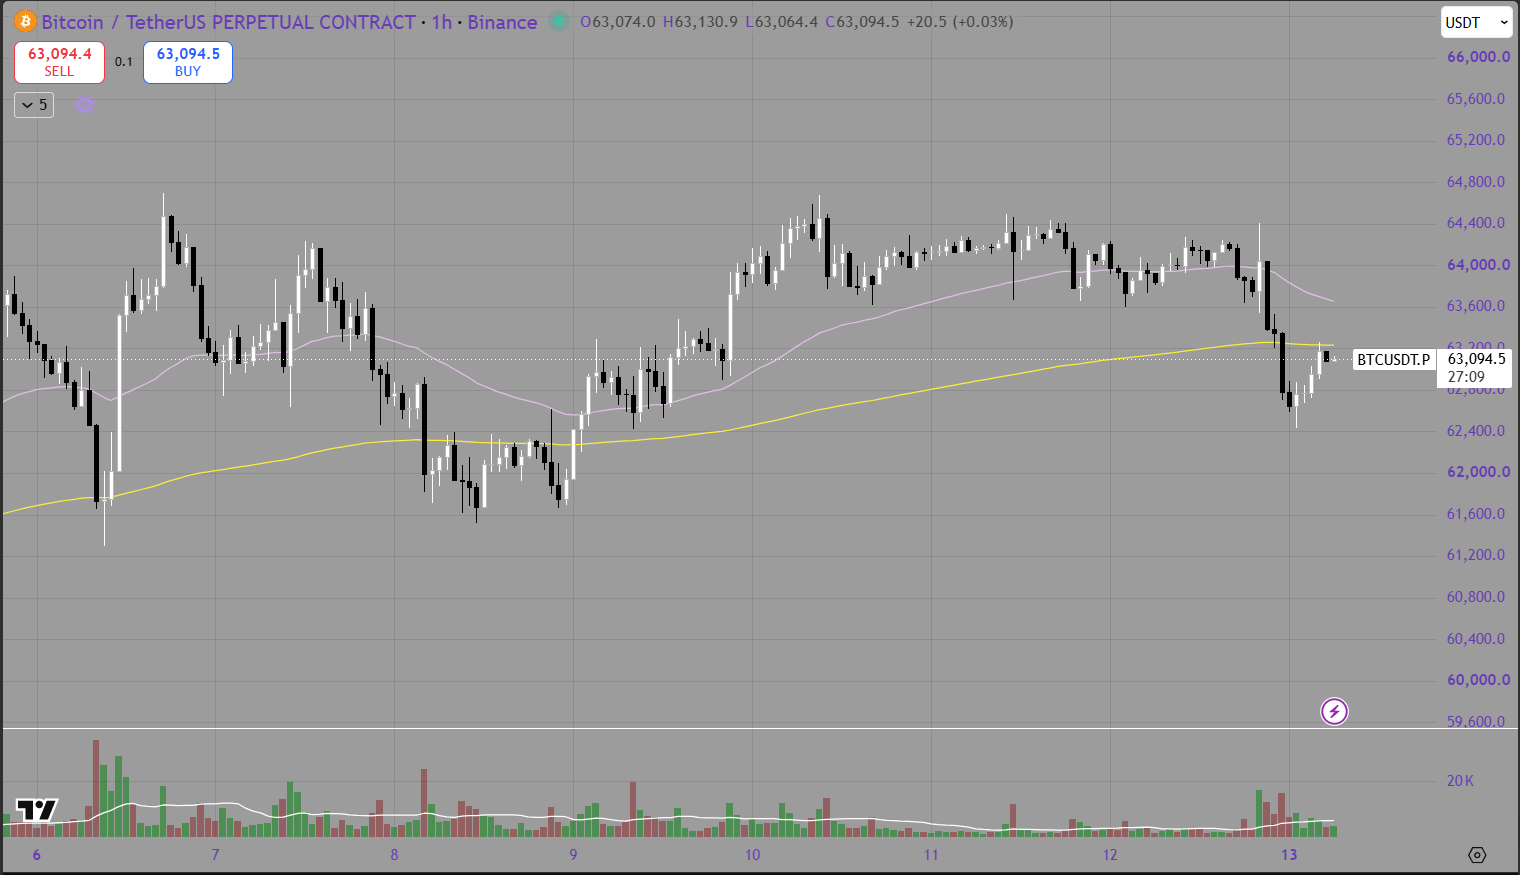
BTC had previously bounced from the $58,000 area and pushed back toward $64,000, but this week price struggled to generate strong continuation. The hourly chart shows Bitcoin trading in a choppy range, with price moving around the 50 EMA and 200 EMA before rejecting from the upper-$64,000 region and returning toward $63,000.
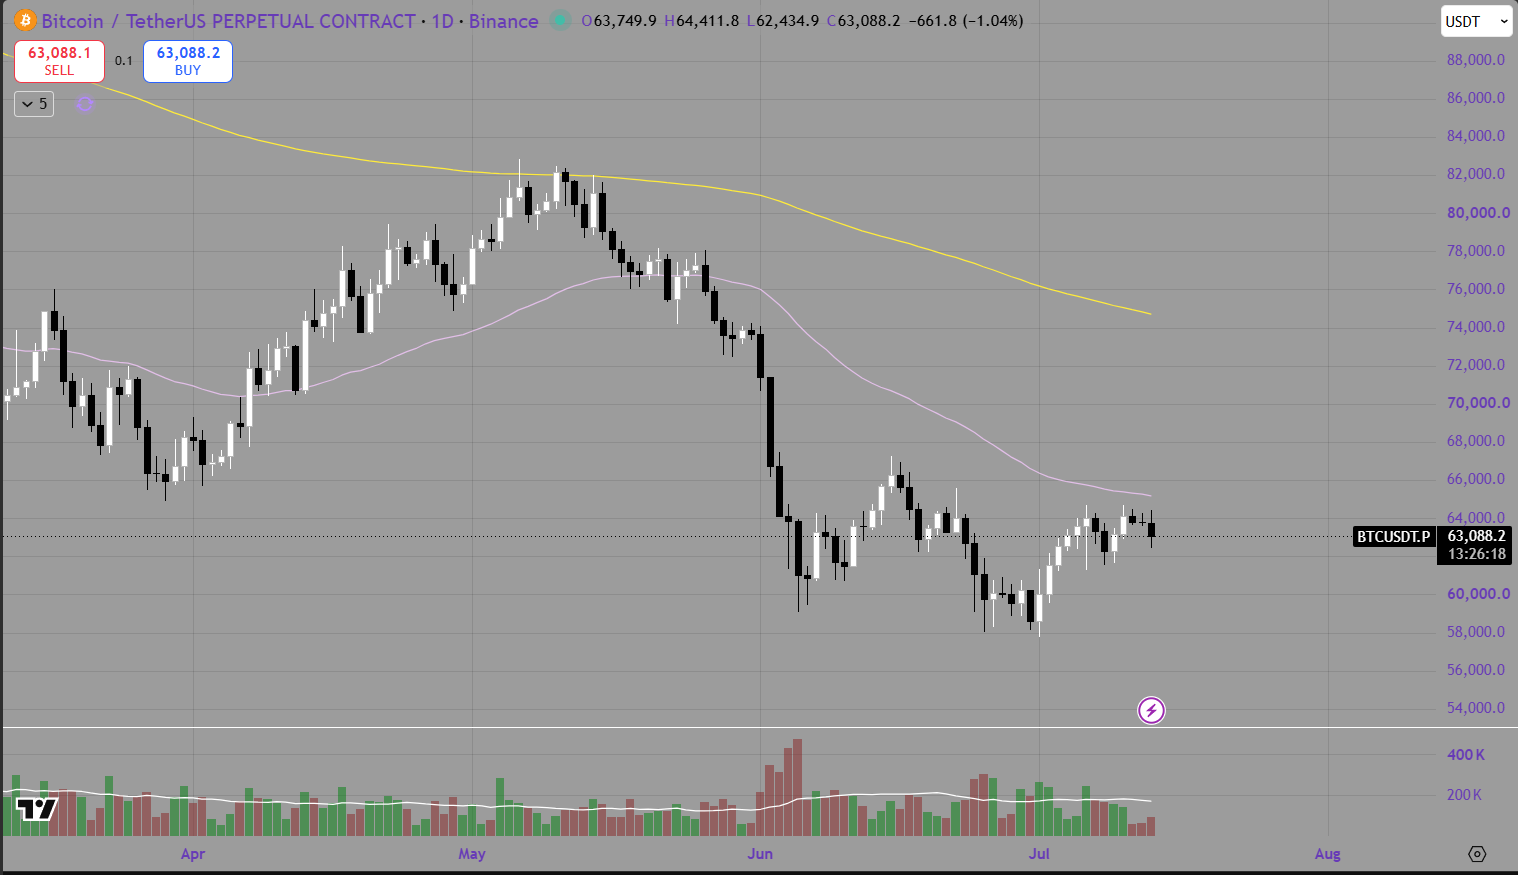
The broader daily chart remains cautious. Bitcoin is still trading below the daily 50 EMA and well below the daily 200 EMA, meaning the market has not yet confirmed a full bullish reversal. The recent recovery has helped stabilise price, but BTC still needs to reclaim higher resistance levels before the structure can shift more confidently in favour of buyers.
The purple line represents the 50 EMA, while the yellow line represents the 200 EMA.
Hourly Analysis (1H)
The hourly chart shows Bitcoin trading in a sideways range for most of the week.
BTC started the period near the $63,000 region before pushing higher toward $64,000. Buyers were able to hold above the yellow 200 EMA for part of the week, which was initially constructive. Price also remained close to the purple 50 EMA, suggesting the market was attempting to maintain short-term balance.
However, Bitcoin failed to build a clean breakout above the $64,000 to $64,500 resistance area. Each push higher was met with selling pressure, and the lack of follow-through showed that buyers were not yet strong enough to drive a larger continuation move.
The key rejection came after BTC briefly moved above $64,000 before falling back below the 50 EMA and testing the 200 EMA. This created a short-term momentum shift, as price lost the higher range and returned toward the $62,500 to $63,000 area.
The important short-term support now sits around $62,400 to $62,800. This is where Bitcoin has recently reacted and where buyers need to defend if the recovery is going to remain intact. A break below this area could open the door for another move toward $61,600, followed by $60,000.
On the upside, Bitcoin needs to reclaim $63,600 to $64,000. A move back above this zone would suggest the recent dip was only a shakeout. If BTC can then break above $64,500, the market may attempt another push toward $65,000 to $66,000.
For now, the hourly chart is neutral to slightly cautious. Bitcoin is no longer showing the same strength as last week’s recovery, but it has also not fully broken down. The market is sitting at a decision point.
Daily Analysis (1D)
The daily chart shows Bitcoin still attempting to recover from the broader sell-off that began after the rejection near the low-$80,000 region.
BTC has bounced from the high-$50,000 region and moved back toward $63,000, but the recovery remains limited when viewed on the daily timeframe. Price is still trading below the purple 50 EMA, which is currently positioned around the mid-$60,000 region. This remains the first major technical level Bitcoin needs to reclaim.
The yellow 200 EMA remains much higher, around the mid-to-high-$70,000 region. This means that even if Bitcoin reclaims the 50 EMA, the larger trend would still need further confirmation before shifting fully bullish.
The current daily structure shows BTC building a possible base between $58,000 and $64,000. This is constructive compared to the sharp breakdown seen earlier in June, but the market still lacks a strong breakout. The move from $58,000 into $64,000 was encouraging, but BTC now needs to hold above $60,000 and avoid rolling back into the previous lows.
The first major daily resistance remains around $64,000 to $66,000. If Bitcoin can reclaim this zone, the next focus becomes the daily 50 EMA and the broader $67,000 to $68,000 area.
On the downside, the $60,000 region remains the most important support zone. If BTC loses this level, the recent recovery could be viewed as a failed bounce, bringing the $58,000 lows back into play.
For now, the daily chart remains in recovery mode, but not yet bullish. Buyers have stabilised price, but they have not yet regained full control.
Summary
Bitcoin had a mixed week, with price consolidating around the low-$60,000 region after last week’s recovery from $58,000 support.
The hourly chart shows BTC struggling to break above the $64,000 to $64,500 resistance zone. Price has pulled back toward $63,000 and is now testing whether the recent recovery structure can hold. The key short-term support zone is around $62,400 to $62,800, while resistance remains around $63,600 to $64,500.
The daily chart remains cautious. Bitcoin is still below the daily 50 EMA and 200 EMA, meaning the broader market has not yet confirmed a full trend reversal. The $58,000 to $60,000 area remains the major support zone, while $64,000 to $66,000 is the key resistance area buyers need to reclaim.
Key levels to monitor this week include:
Immediate resistance: $63,600 to $64,000
Higher resistance: $64,000 to $64,500
Upside target: $65,000 to $66,000
Initial support: $62,400 to $62,800
Key support: $61,600 to $62,000
Major support: $58,000 to $60,000
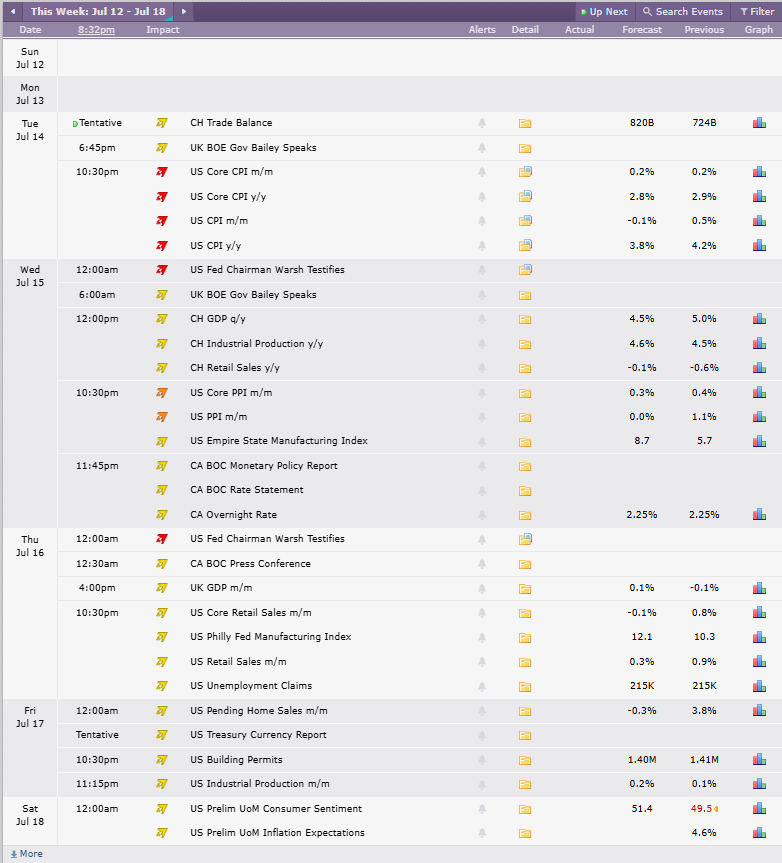
Looking ahead, the main red-folder events from the Crypto Craft calendar are:
US Core CPI m/m
US Core CPI y/y
US CPI m/m
US CPI y/y
US Fed Chairman Warsh Testifies
Credit: Crypto Craft
These events could create meaningful volatility across Bitcoin and broader risk markets. CPI data will be especially important, as inflation readings can influence bond yields, the US dollar and Federal Reserve policy expectations.
If inflation comes in hotter than expected, Bitcoin may face renewed pressure as markets price in tighter financial conditions for longer. If CPI comes in softer, it could support risk sentiment and help BTC attempt another move toward the $64,000 to $66,000 resistance zone.
For now, Bitcoin is still trying to stabilise after a major sell-off. The short-term structure is not broken, but it needs confirmation. A reclaim above $64,500 would improve the bullish case, while a loss of $62,400 could shift momentum back toward sellers.
