
Weekly Bitcoin Price Analysis & Forecasts the 8th June - 14th June 2026
Following on from last week’s sharp breakdown into the low-$60,000 region, Bitcoin showed the first signs of short-term recovery during the week of 8th June to 14th June 2026.
BTC began the week attempting to stabilise around the $60,000 to $61,000 area before gradually rebuilding momentum. Buyers were able to push price back through the hourly 50 EMA and 200 EMA, eventually lifting Bitcoin into the mid-$65,000 region.
While this is a constructive improvement, the broader daily trend remains under pressure. Bitcoin is still trading well below the daily 50 EMA and 200 EMA, meaning the recent move should currently be treated as a relief recovery rather than confirmation of a wider bullish reversal.
The next phase will depend on whether buyers can hold the reclaimed short-term support levels and continue pushing toward the higher resistance zones above $66,000.
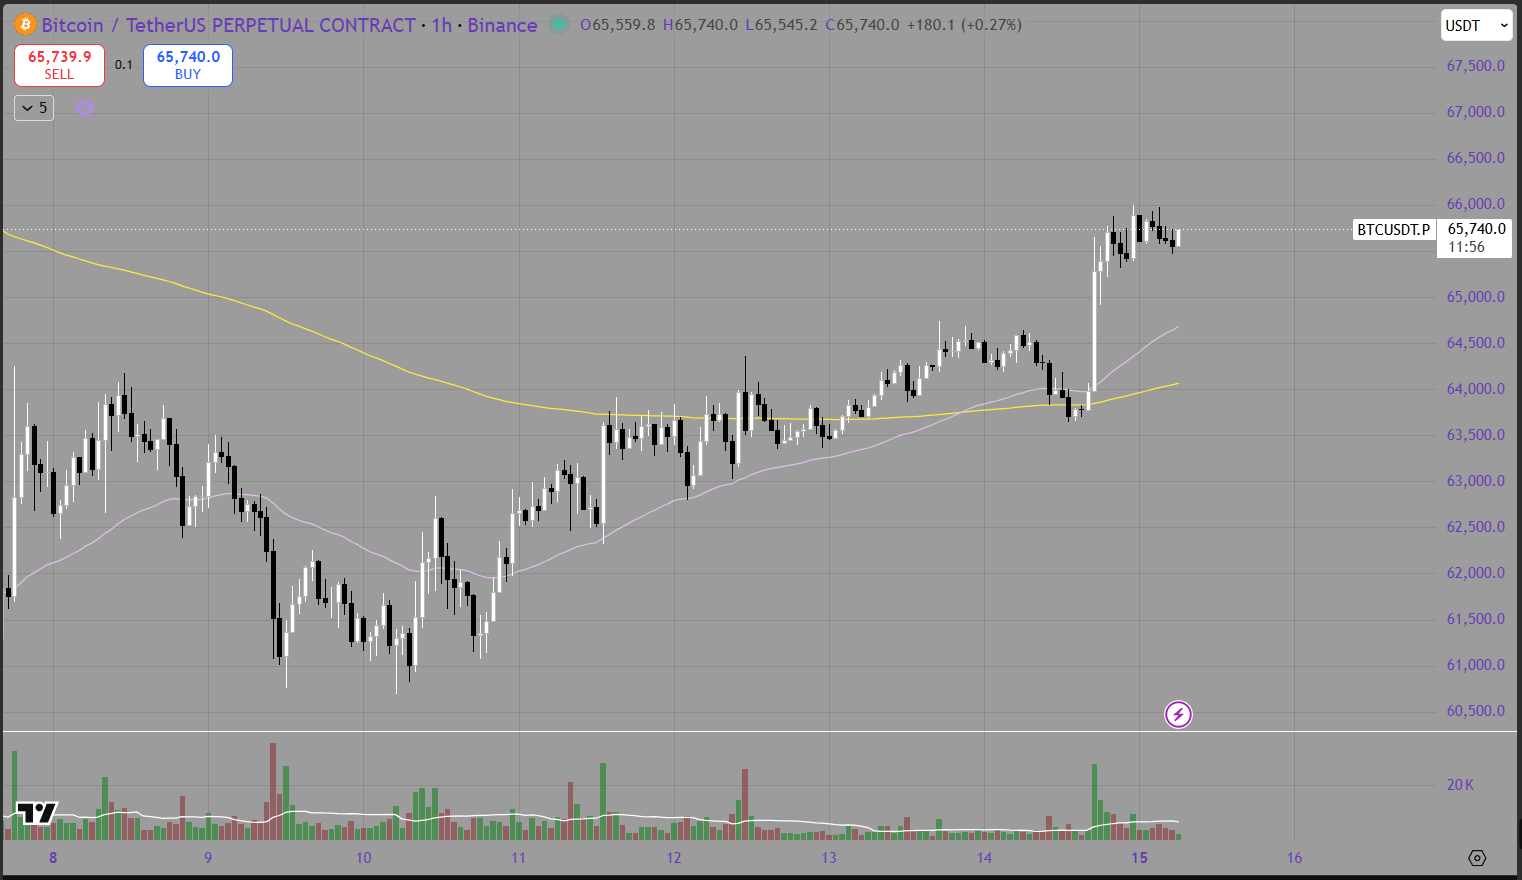
Hourly Analysis (1H)
The hourly chart shows a clear improvement in Bitcoin’s short-term structure.
BTC entered the week near the low-$60,000 region after the significant sell-off seen during the previous period. Price initially consolidated around $60,500 to $61,000, showing that sellers were beginning to lose momentum around the recent lows.
From there, Bitcoin started forming a sequence of higher lows. Price gradually recovered through $62,000 and $63,000 before reclaiming the purple 50 EMA. This was the first meaningful indication that short-term momentum was beginning to shift back toward buyers.
The more important development came when BTC reclaimed the yellow 200 EMA around the $63,500 to $64,000 region. Price initially consolidated around these moving averages before producing a strong bullish expansion toward $65,500.
This breakout was supported by a noticeable increase in volume, suggesting that the move was driven by genuine buying interest rather than only low-liquidity price movement.
Bitcoin is now consolidating around $65,500 to $66,000 following the breakout. This is a positive sign because price has not immediately retraced the move. However, the market is also approaching an area where sellers may begin to re-enter.
The main hourly resistance zone is currently between $65,800 and $66,500. A clean break and hold above this region could allow BTC to target $67,000, followed by the larger $68,000 area.
On the downside, the first support zone sits around $64,500. This area is supported by the rising 50 EMA and the recent breakout structure. Below that, the $63,500 to $64,000 region becomes the more important support zone because it contains the hourly 200 EMA and the previous consolidation range.
If BTC remains above both moving averages, the hourly structure stays constructive. A loss of $63,500 would weaken the recovery and increase the risk of another move toward $62,000.
Daily Analysis (1D)
The daily chart shows that Bitcoin has started recovering from the sharp breakdown, but the broader trend remains bearish.
BTC previously fell from the low-$80,000 region into the $60,000 area, with the move accelerating once price broke below the daily 50 EMA. Selling volume increased significantly during the decline, confirming that the breakdown carried meaningful bearish momentum.
This week, Bitcoin managed to rebound from the low-$60,000 region and move back toward $65,700. The rebound has produced several stronger daily candles and suggests that buyers are attempting to establish a base around the recent lows.
However, price is still trading far below the purple daily 50 EMA, which sits around the low-$70,000 region. The yellow daily 200 EMA remains even higher, near the upper-$70,000 region. Both moving averages continue to slope downward and therefore remain major resistance levels.
The first important daily resistance zone is around $66,000 to $67,500. This region previously acted as support before the latest breakdown and may now act as resistance. If Bitcoin can reclaim it, the next major target would be the $70,000 to $72,000 region, where the daily 50 EMA is likely to become a significant test.
The key support remains around $60,000 to $61,000. This area has now produced a strong reaction and will be critical if Bitcoin experiences another pullback. Holding above it would allow the market to continue building a possible base. Losing it would reopen the risk of a move toward the upper-$50,000 region.
The daily chart has therefore improved, but it has not yet shifted bullish. The current recovery needs to develop into a sustained sequence of higher lows and higher highs before the broader trend can be considered repaired.

Summary
Bitcoin produced a constructive recovery during the week, bouncing from the low-$60,000 region and reclaiming both major moving averages on the hourly chart.
The hourly structure has improved considerably, with BTC now trading above the 50 EMA and 200 EMA. The breakout toward $65,500 was supported by stronger volume, suggesting buyers are beginning to regain short-term control.
The daily chart remains more cautious. Bitcoin is still trading below both the daily 50 EMA and 200 EMA, so the broader trend has not yet reversed. For now, the move should be viewed as a relief recovery within a larger bearish structure.
The key technical levels to monitor are:
Resistance around $65,800 to $66,500
Higher resistance around $67,500 to $68,000
Initial support near $64,500
Major short-term support around $63,500 to $64,000
Broader daily support near $60,000 to $61,000
Looking ahead, the main red-folder events from the Crypto Craft calendar are scheduled for Thursday:
US Federal Funds Rate
US FOMC Economic Projections
US FOMC Statement
US FOMC Press Conference

Credit: Crypto Craft
These events have the potential to create significant volatility across Bitcoin and broader risk markets. While the Federal Funds Rate is expected to remain unchanged at 3.75%, the market reaction may depend more heavily on the FOMC projections, policy language and comments from the press conference.
A more dovish outlook could support Bitcoin’s recovery by lowering expectations for future interest rates and easing pressure on bond yields. A more hawkish message could strengthen the US dollar, increase yields and place renewed pressure on BTC.
For now, Bitcoin’s short-term structure is improving, but the recovery still needs confirmation. Holding above the hourly moving averages and breaking through $66,500 would strengthen the bullish case, while a rejection back below $63,500 would suggest the market remains vulnerable to another retest of the recent lows.