
Weekly Bitcoin Price Analysis & Forecasts the 1st June - 7th June 2026
Following on from last week’s weakness, Bitcoin continued to come under pressure during the week of 1st June to 7th June 2026. BTC had already started to lose momentum after failing to hold the higher recovery range, and this week saw that weakness accelerate into a sharper move lower.
The key shift this week was the breakdown from the low-$70,000 region into the low-$60,000 region. On both the hourly and daily charts, Bitcoin remains below the major moving averages, with the purple line representing the 50 EMA and the yellow line representing the 200 EMA. This shows that the broader trend is still being controlled by sellers.
While BTC did see a small bounce from the recent lows, the market has not yet shown enough strength to confirm a meaningful reversal. For now, the move looks more like a relief bounce within a bearish structure rather than a confirmed recovery.
Hourly Analysis (1H)
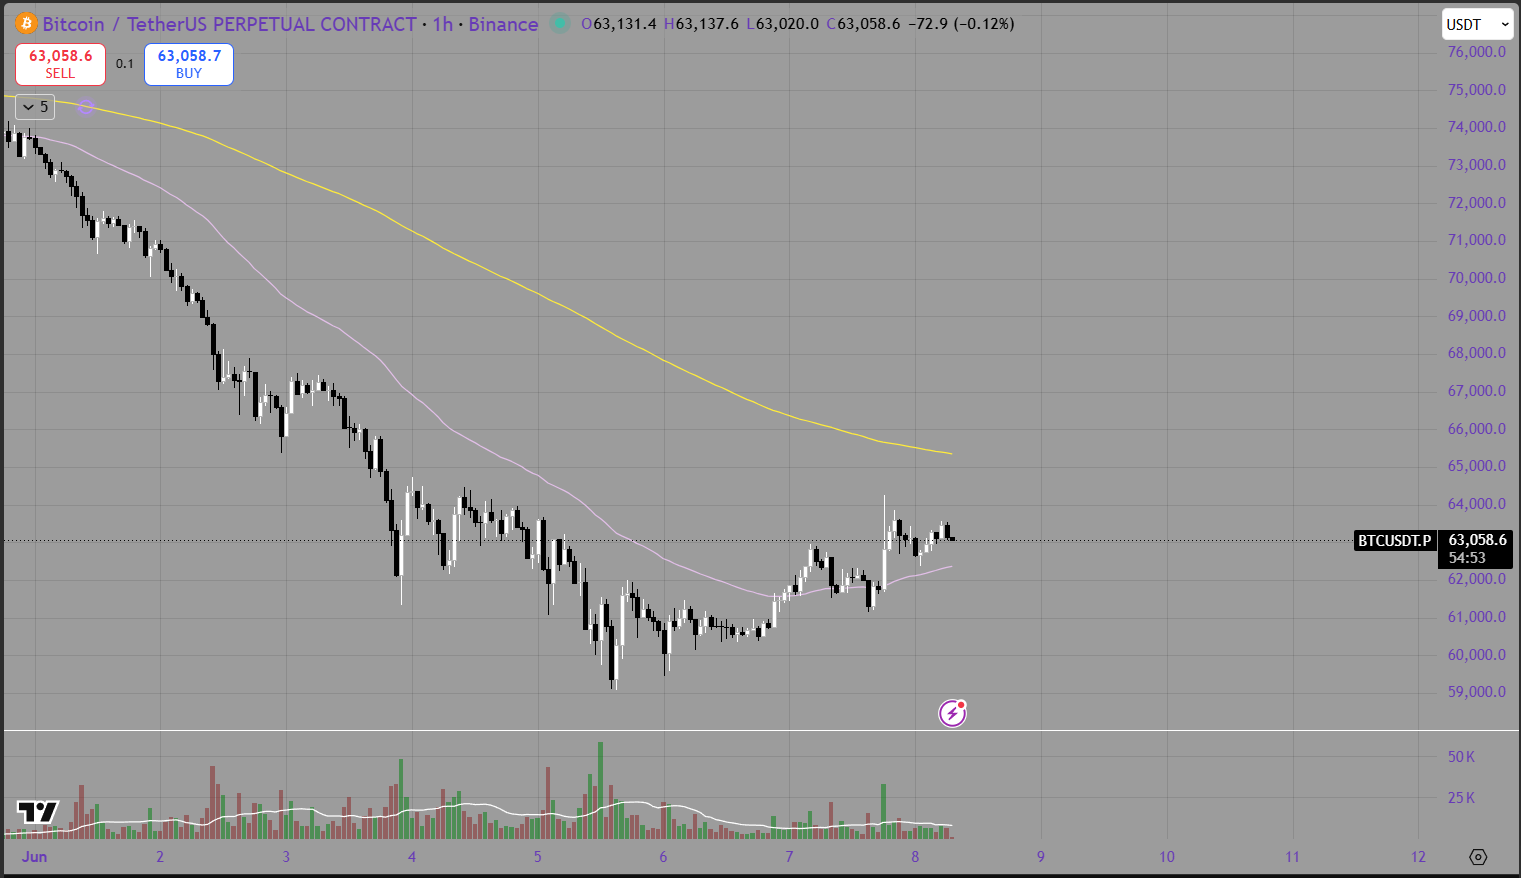
The hourly chart shows Bitcoin trending lower for most of the week. Price began around the mid-$70,000 region before continuing to bleed lower, eventually pushing into the $60,000 to $63,000 range.
The major issue on the hourly chart is that BTC remains below both the 50 EMA and 200 EMA. The yellow 200 EMA is still sitting well above price, showing that the broader short-term trend is bearish. The purple 50 EMA has also acted as dynamic resistance throughout the move lower, with Bitcoin failing to reclaim it with any real strength.
After selling into the low-$60,000 region, BTC attempted to stabilise and bounce back toward the $63,000 area. This is a positive short-term reaction, but it is not enough on its own. Buyers need to push price back above the 50 EMA before the hourly structure can begin to repair.
The key level to watch now is the $64,000 region. If Bitcoin can reclaim and hold above this area, it may attempt a move toward $65,000 to $66,000. However, if BTC fails here and rolls over again, the recent lows around $60,000 become the next major support zone.
A clean break below $60,000 would be significant. It would show that sellers are still in control and could trigger another leg lower. Until BTC reclaims the 50 EMA and starts forming higher highs, the hourly chart remains bearish.
Daily Analysis (1D)
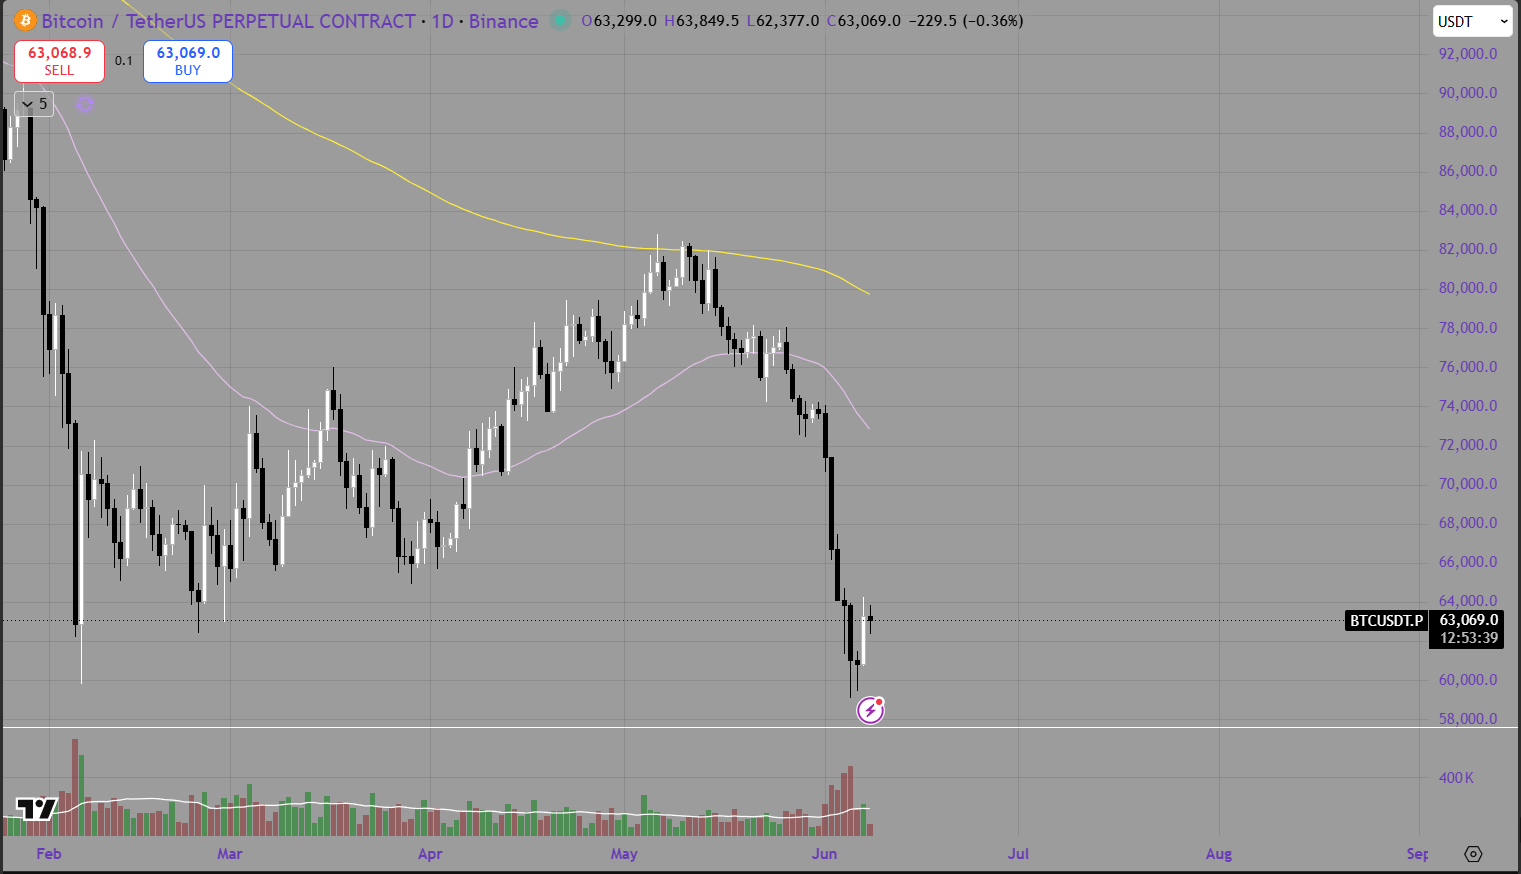
The daily chart shows the broader damage more clearly. Bitcoin has now rejected from the recovery structure that developed through April and May, with price falling sharply from the $80,000 region into the low-$60,000 range.
The rejection from the yellow 200 EMA remains the key technical takeaway. BTC was unable to reclaim the daily 200 EMA during its recovery attempt, and once buyers failed to hold momentum, sellers stepped back in aggressively. This confirms that the broader market is still not in a confirmed bullish reversal.
The purple 50 EMA has now also become resistance on the daily chart. Price is trading well below it, which suggests that the medium-term trend has weakened again. For Bitcoin to repair the daily structure, it first needs to reclaim the $66,000 to $68,000 region, then eventually push back toward the 50 EMA.
The current daily candle structure shows some stabilisation around the low-$60,000 area, but the bounce is still early. The market needs to see follow-through buying before calling this a bottom. Without that, the risk remains that BTC is simply consolidating before another move lower.
The major support zone is now around $60,000. This is both a psychological level and a key area where buyers need to defend the market. If BTC can hold above $60,000 and start building higher lows, the market may begin forming a base. If that level breaks, the next downside move could become much more aggressive.
Summary
Bitcoin had another weak week, with price breaking down from the low-$70,000 region and moving into the low-$60,000 range. The hourly chart remains bearish, with BTC still trading below both the 50 EMA and 200 EMA. The daily chart also remains under pressure, with Bitcoin failing to reclaim the daily 200 EMA and now trading below the daily 50 EMA.
The key technical takeaway is that BTC needs to reclaim the $64,000 to $66,000 region to begin repairing short-term momentum. Until then, the market remains vulnerable. The $60,000 level is now the major support zone to watch. A strong hold above this area could allow Bitcoin to form a base, but a clean break below it would likely increase downside pressure.
Looking ahead, the main red-folder events from the Crypto Craft screenshot are:
US Core CPI m/m
US CPI m/m
US CPI y/y
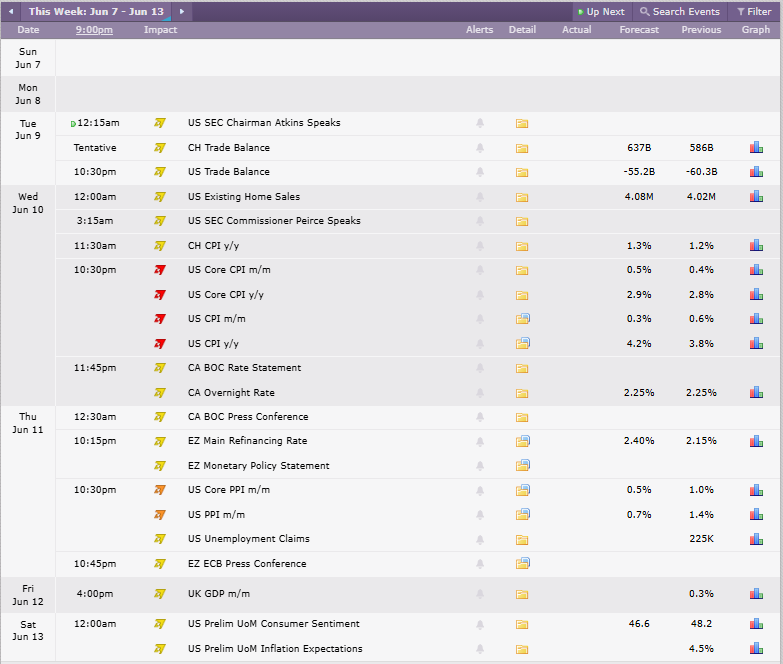
Credit: Crypto Craft
These are the key events to watch because inflation data can directly impact bond yields, Federal Reserve expectations, and broader risk sentiment. If CPI comes in hotter than expected, it may place further pressure on Bitcoin and risk assets. If CPI comes in softer, it could help stabilise the market and support a short-term bounce.
For now, Bitcoin remains in a bearish structure. The market has attempted to bounce from the low-$60,000 region, but buyers still need to prove strength. Until BTC reclaims key moving averages and rebuilds above $66,000, caution remains the priority.