
Weekly Bitcoin Price Analysis & Forecasts9th March – 15th March 2026
Bitcoin spent the week of 9th March to 15th March attempting to build on the stabilisation seen in previous sessions, with price action finally showing a more constructive tone across the lower timeframe. After several weeks of heavy downside pressure, BTC has started to form a short-term recovery structure, helped by improving momentum on the hourly chart and a modest reclaim of key moving averages.
That said, broader markets remain highly sensitive to macro and geopolitical risk. The ongoing war involving Iran continues to weigh on global sentiment, particularly through higher oil prices and stronger bond demand. Rising oil has added to inflation concerns, while the move into bonds reflects a continued risk-off tone in traditional markets. For Bitcoin, this creates a mixed environment where improving technical structure can still be disrupted by headline-driven volatility and broader macro repricing.
Hourly Analysis (1H)
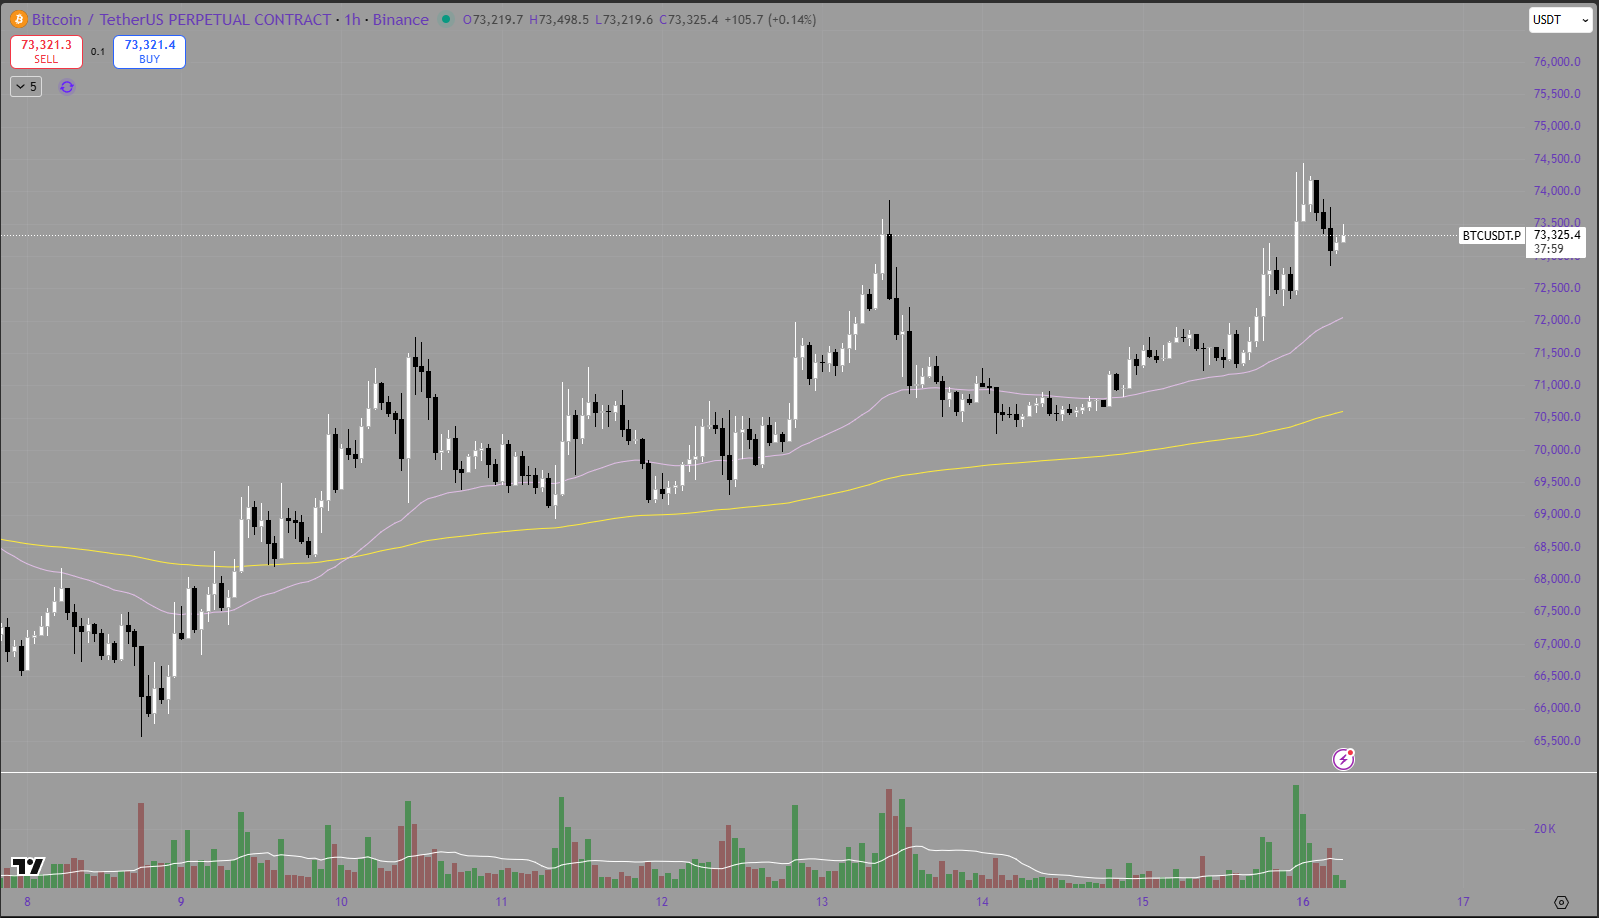
On the hourly timeframe, Bitcoin showed a much healthier structure than in recent weeks. Price spent most of the week grinding higher, forming a sequence of higher lows and gradually reclaiming lost ground. This shift in character suggests that sellers have at least temporarily lost full control of the short-term trend.
The recovery move was supported by price pushing back above the short-term moving averages, with the purple EMA acting more as support than resistance for much of the week. BTC also managed to reclaim the yellow moving average on the hourly and hold around it, which is an encouraging development after the prolonged weakness seen earlier in March.
A clear breakout leg occurred mid-week, with price pushing into the low $70,000s before pulling back slightly and then continuing to build higher. That move shows there is still demand underneath the market when momentum improves. Into the end of the week, Bitcoin was trading near local highs, suggesting buyers remain active.
Overall, the hourly chart now looks constructive. Momentum has improved, the market is printing higher lows, and BTC appears to be transitioning from pure recovery into an early trend-building phase.
Daily Analysis (1D)
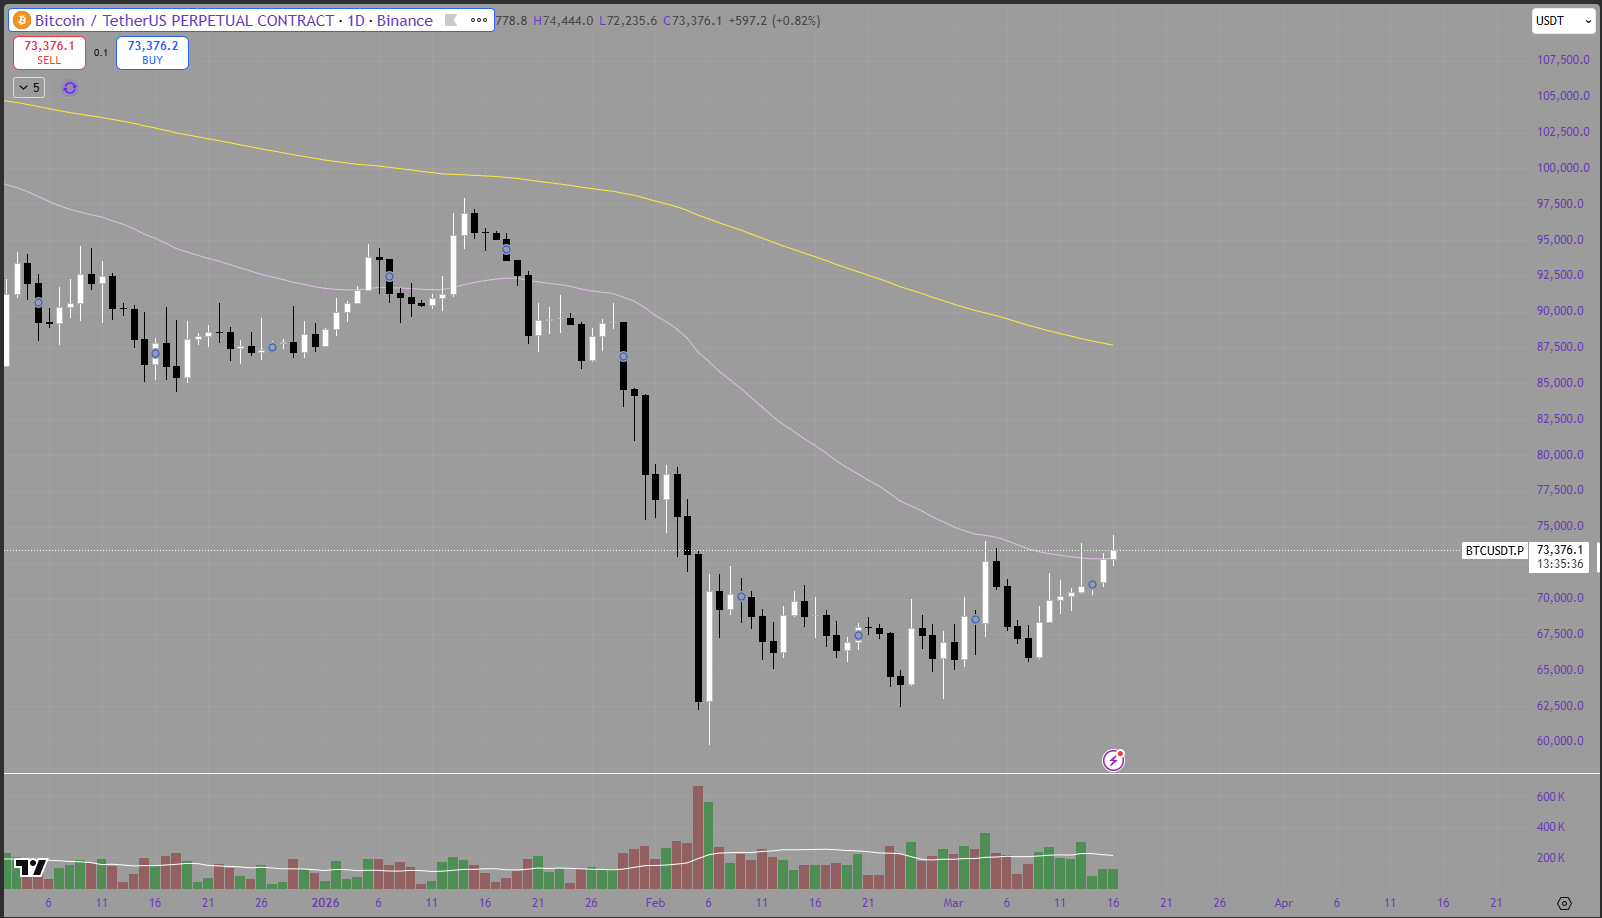
The daily chart still requires more caution. Although Bitcoin has bounced well from the February and early March lows, the broader structure remains corrective. BTC is still trading below major higher-timeframe resistance, and while this week’s daily candles have improved noticeably, the market has not yet fully invalidated the broader downtrend.
What is constructive is that price has begun to stabilise after the earlier capitulation move. The daily candles show a more controlled recovery rather than panic-driven volatility, and BTC is now trying to base around the upper end of the recent range. This suggests that the worst of the immediate liquidation phase may be behind us, at least for now.
However, the larger trend still needs confirmation. Price remains beneath longer-term resistance, and until Bitcoin can reclaim those higher zones on a daily closing basis, the broader market will still be viewed as being in a correction rather than a new bullish trend.
In simple terms, the daily chart is improving, but not yet fully bullish. The market has moved from breakdown to stabilisation, and now needs follow-through.
Summary
Bitcoin showed meaningful improvement this week, particularly on the hourly timeframe where price action became much more constructive. The market formed higher lows, reclaimed key moving averages, and pushed into the low $70,000s, suggesting that short-term sentiment has improved materially.
At the same time, the broader macro backdrop remains challenging. The ongoing war in Iran has continued to affect markets through rising oil prices and stronger bond demand. Higher oil prices increase inflation concerns, while stronger bonds suggest investors are still defensive. That combination tends to pressure broader risk assets and can quickly feed into crypto volatility if macro sentiment worsens.
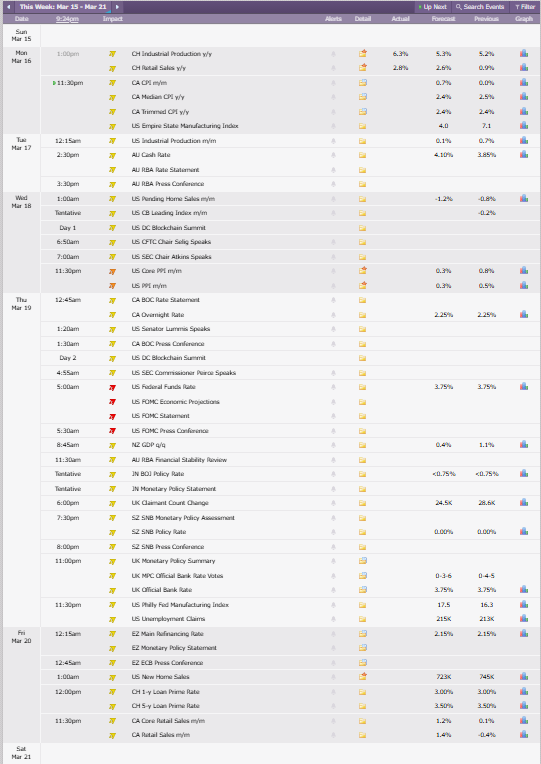
Looking ahead, the key high-impact events from the Crypto Craft calendar are concentrated around US monetary policy and inflation-related releases. The main red-folder events to watch are:
US Core PPI m/m
US PPI m/m
US Federal Funds Rate
US FOMC Economic Projections
US FOMC Statement
US FOMC Press Conference
These events will likely be the major drivers for Bitcoin next week. If the Federal Reserve delivers a more cautious or hawkish tone, risk assets could face renewed pressure. On the other hand, if markets interpret the statement and projections as supportive for liquidity later in the year, Bitcoin may have room to continue its recovery.
For now, BTC has improved technically, but the next major move will likely depend on how markets digest the combination of geopolitical tension, higher oil, stronger bonds, and Federal Reserve guidance.
Credit: Crypt Craft