
Weekly Bitcoin Price Analysis & Forecasts16th March – 22nd March 2026
Bitcoin spent the week of 16th March to 22nd March 2026 trading in a far more balanced manner than the violent price action seen earlier in the quarter, but the market still remains in a broader recovery phase rather than a confirmed bullish trend. After the sharp breakdown in February and the choppy attempts to stabilise through early March, BTC now appears to be building a more defined short-term structure. The key difference this week was that price began to hold higher intraday lows more consistently, while buyers showed a greater willingness to step in on dips instead of simply reacting after sharp sell-offs.
That said, the broader macro backdrop remains complicated. The ongoing war in Iran continues to influence market sentiment across all asset classes. Heightened geopolitical instability in the Middle East has supported stronger oil prices, while capital has also moved into bonds as investors seek relative safety. That combination matters because higher oil raises inflation concerns, while stronger bond demand reflects a more defensive market tone. For Bitcoin, this creates a conflicting setup. On one hand, risk appetite can weaken when global uncertainty rises. On the other, persistent inflation pressure and concerns around fiat debasement can reinforce the longer-term investment case for hard assets and alternative stores of value.
This week’s price action reflected that push and pull. Bitcoin did improve from the panic conditions seen previously, but it was still trading inside a broader technical recovery rather than a clean breakout environment. The hourly chart shows constructive short-term behaviour, while the daily timeframe still requires more proof before a full trend reversal can be called.
Hourly Analysis (1H)
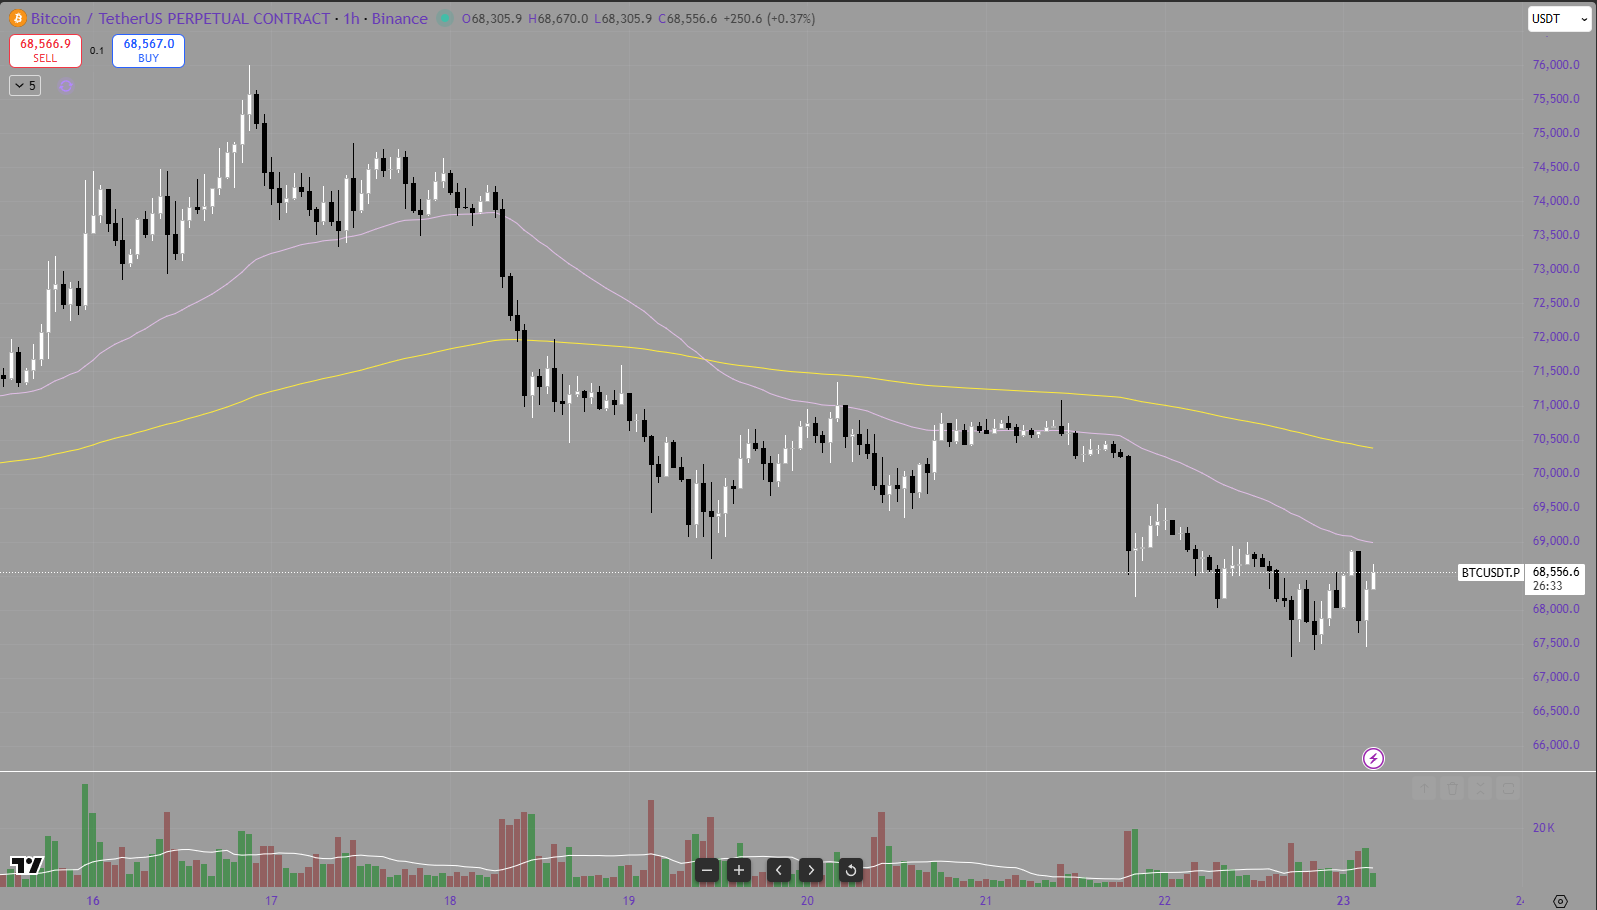
The hourly chart provides the clearest picture of how Bitcoin behaved this week. Rather than trending impulsively in one direction, BTC moved through a series of controlled swings that gradually improved the short-term structure. The market was no longer printing the aggressive lower lows that defined prior weeks. Instead, we saw a much healthier sequence of stabilisation, reclaim, pullback, then continuation.
Early in the period, Bitcoin was already trying to recover from the prior sell pressure, and that recovery started to gain credibility once price pushed back above the shorter moving average and held there. From that point, the purple moving average stopped acting purely as resistance and began functioning more like a dynamic support guide for short-term momentum. That shift is important because it signalled that buyers were no longer just absorbing downside, they were actively defending higher prices.
The market then worked higher through a staircase structure. Rather than a single vertical move, the rally developed in phases:
a reclaim of local support,
a controlled push through prior intraday highs,
a pause and consolidation,
then another push into the upper end of the week’s range.
That kind of step-by-step price action is generally healthier than a straight vertical squeeze, because it shows the market is finding acceptance at progressively higher levels.
The strongest part of the hourly chart this week was the middle section of the move, where BTC pushed into the low-$70,000 region. That breakout leg came with enough momentum to suggest the market was not simply short covering for a few candles, but rather beginning to rotate into a more constructive short-term phase. However, once price reached that upper zone, follow-through slowed. Profit-taking emerged, and the market began to roll over slightly from the highs.
That later weakness is important. Although Bitcoin had built a better structure, it still could not fully escape the gravitational pull of the broader risk environment. The market began to give back part of the advance, showing that sellers remain active whenever BTC pushes into higher supply zones. This tells us the hourly trend improved, but it did not yet become fully impulsive to the upside.
From a structure perspective, the most important hourly observations this week were:
Bitcoin formed a series of higher lows after the prior capitulation phase.
The short-term moving average was reclaimed and held for much of the advance.
Buyers showed up consistently on dips rather than waiting for extreme liquidation levels.
The rally lost some energy into the latter part of the week, showing that higher resistance is still respected.
In practical terms, the hourly timeframe now looks transitional. It is no longer in a clear breakdown mode, but it is also not yet in a decisive expansion phase. Bitcoin is behaving like a market trying to carve out a tradable recovery inside a larger corrective environment.
Daily Analysis (1D)
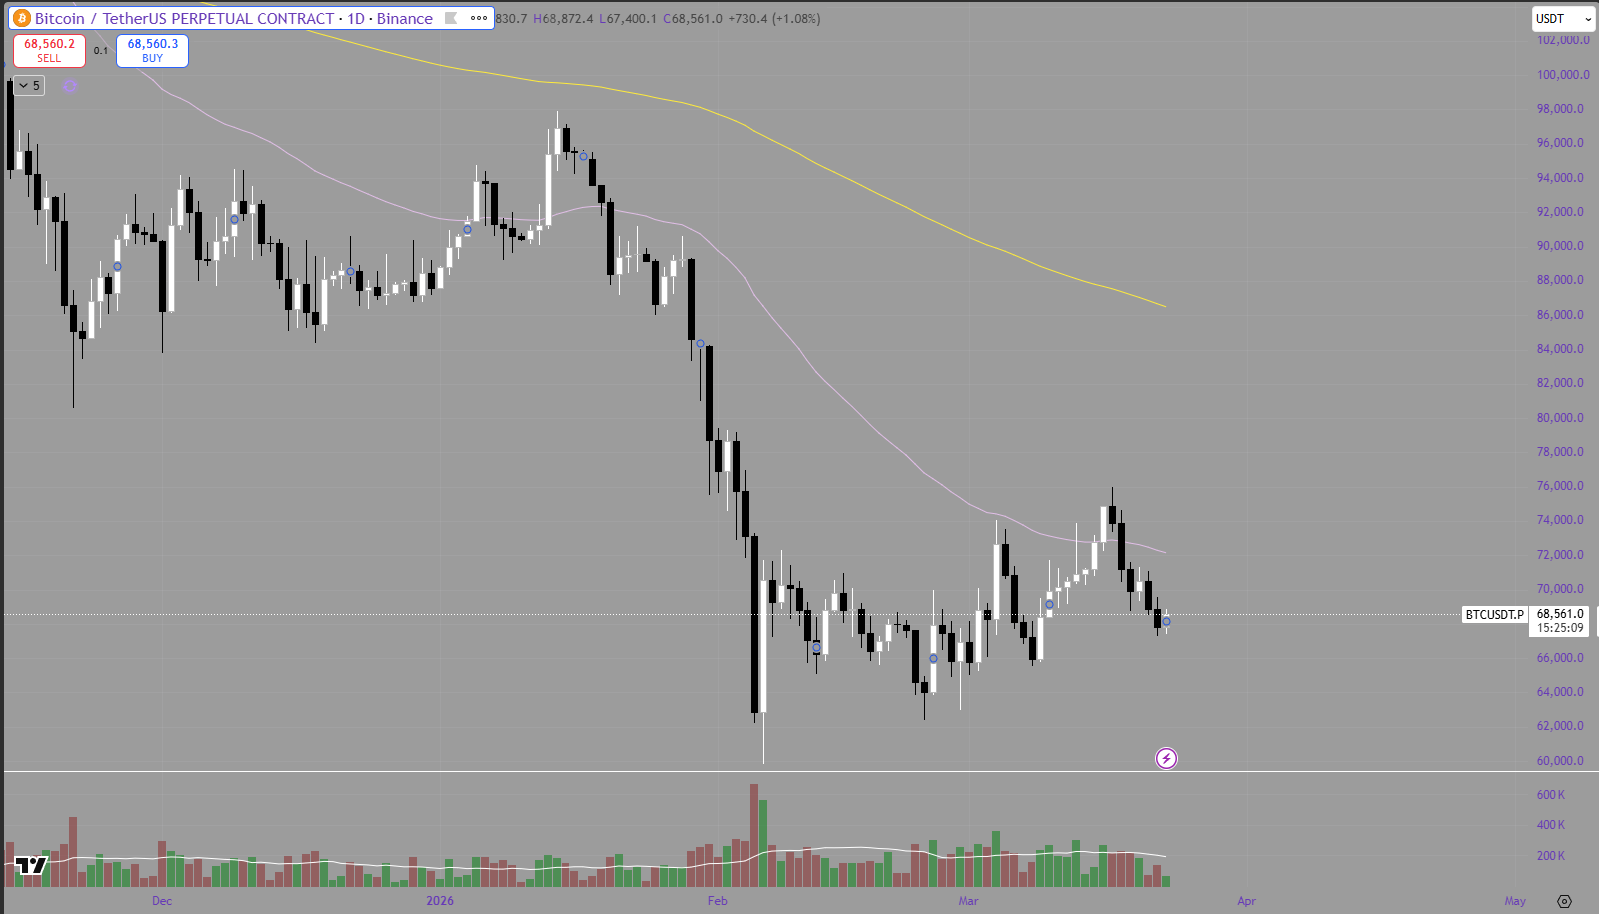
The daily chart remains the more important framework, because it tells us whether this week’s hourly improvement actually changes the broader market picture. At this stage, the answer is only partially.
The daily structure is still technically corrective. Bitcoin remains well below its major long-term moving average, and the yellow moving average continues to slope downward. That alone means the macro trend is not yet bullish. Any recovery must still be viewed through the lens of a broader market that has been under pressure for months.
However, the daily chart does show some genuine improvement compared with the panic conditions that followed the February breakdown. The market is no longer cascading lower with huge impulsive red candles. Instead, daily price action has slowed, range behaviour has increased, and BTC has started forming a more stable base in the upper-$60,000 region.
That matters because base-building is often the first step toward a larger repair process. Before Bitcoin can reclaim major trend resistance, it usually needs to stop falling first, then establish equilibrium, then begin producing higher lows on the daily timeframe. The last two weeks suggest we may be in that equilibrium-building phase now.
One of the more constructive elements on the daily chart is that price has begun to hold within a tighter band instead of making fresh collapse lows. The market is effectively attempting to create a floor. It is not yet a confirmed bottom, but it is a notable shift from the one-directional weakness seen earlier.
At the same time, the daily chart still shows clear limitations:
Price remains below long-term trend resistance.
The recovery lacks a decisive daily close through a major overhead supply zone.
Previous breakdown areas have not yet been fully reclaimed.
The market continues to trade in a corrective posture rather than a new trend leg.
This is where the geopolitical backdrop also becomes relevant. The ongoing war in Iran and the resulting surge in oil prices has likely contributed to a more cautious tone in broader markets. Higher oil creates inflation pressure, which in turn can make central banks less comfortable easing policy quickly. At the same time, the move higher in bond prices suggests investors are still positioning defensively. For Bitcoin, that means every recovery attempt is being judged not just on technical merit, but on whether the macro environment will allow risk assets to sustain momentum.
So while the daily chart has improved from “panic sell-off” to “structured stabilisation,” it has not yet shifted into a confirmed bullish trend. The market is in repair mode. That is better than breakdown mode, but it still demands patience.
Summary
Bitcoin had a noticeably better week from a structural perspective, particularly on the hourly chart. The market managed to form higher lows, reclaim short-term moving averages, and push toward the low-$70,000 region before meeting resistance. Compared with the weakness seen in February and early March, this is a meaningful improvement. It suggests that sellers no longer have complete control of short-term price action.
The daily chart also showed progress, although it remains more cautious. BTC is no longer in free-fall and appears to be building a base around the upper-$60,000 area. That is constructive, but not yet enough to confirm a larger trend reversal. Bitcoin is still trading below major long-term resistance, so any bullish thesis still needs more confirmation.
From a macro perspective, the ongoing war in Iran continues to matter. The resulting rise in oil prices has increased inflation concerns, while the strength in bond prices reflects a defensive tone in broader markets. That combination is important because it can limit risk appetite across equities and crypto, even when short-term technicals begin improving. In other words, Bitcoin’s recovery is happening in a market environment that still contains meaningful external pressure.
Looking ahead, the key high-impact events from the Crypto Craft calendar are concentrated around US macro data and Fed communication. The main red-folder events to watch are:
US Flash Manufacturing PMI
US Flash Services PMI
US Federal Funds Rate
US FOMC Economic Projections
US FOMC Statement
US FOMC Press Conference
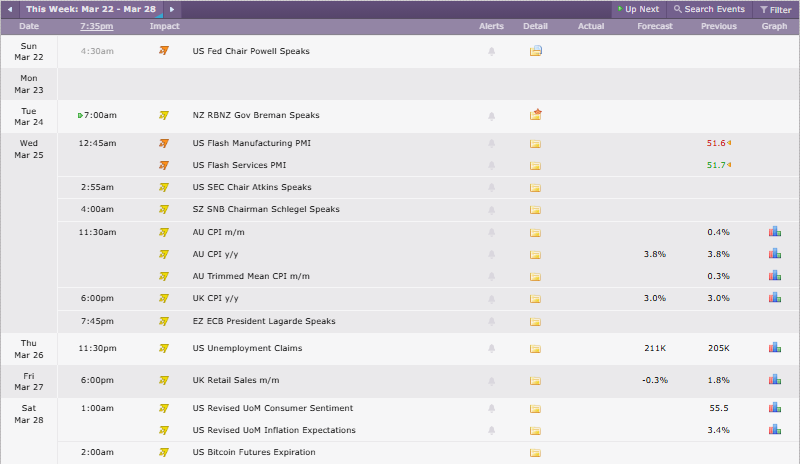
Credit: Crypto Craft
These will be the major drivers for Bitcoin next week. PMI data will offer an early read on economic momentum, while the Federal Reserve events are likely to dominate market direction. If the Fed sounds more hawkish or pushes back against easing expectations, Bitcoin could struggle to extend its recovery. If the statement and projections are interpreted as less restrictive, BTC may have room to continue building on the constructive hourly structure seen this week.
At this stage, Bitcoin is transitioning from breakdown to recovery, but it has not yet completed that journey. The short-term chart is encouraging, the daily chart is stabilising, and the next major move will likely be determined by how markets digest the combination of geopolitical tension, stronger oil and bond markets, and Federal Reserve policy signals.