
Weekly Bitcoin Price Analysis & Forecasts 30th March - 05th April 2026
Bitcoin spent the week of 30th March to 5th April 2026 trying to stabilise after a difficult broader corrective phase, but the market still traded under a heavy macro shadow. While BTC managed to recover into the upper-$60,000 region on the hourly chart, the move still looks more like a relief rebound inside a wider recovery range than the start of a fully confirmed bullish expansion. That hesitation makes sense given the macro backdrop. The U.S.-Israeli war with Iran has continued to disrupt sentiment across global markets, with the Strait of Hormuz remaining a major focal point for energy supply concerns. Reuters reported that the conflict has kept oil prices elevated, helped fuel inflation fears, and left markets highly sensitive to every fresh headline or policy threat from Washington.
The war has mattered for Bitcoin not because BTC trades like oil, but because it changes the broader market environment around inflation, liquidity, and risk appetite. Higher oil prices increase the chance that inflation remains sticky, while defensive flows into bonds and the U.S. dollar typically signal a more cautious global market tone. Reuters noted that markets have been grappling with the inflationary implications of the Hormuz disruption, while rising demand for safer assets and a stronger dollar have complicated the outlook for risk assets.
There is also an additional layer of caution going into the new week. Trump has publicly escalated his rhetoric, including social-media threats and ultimatums aimed at Iran over reopening the Strait of Hormuz, which suggests the conflict may be approaching another decisive turning point rather than cooling off. Reuters reported that Trump warned of attacks on Iranian infrastructure if the strait is not reopened, reinforcing fears that markets could be hit with another volatility shock if the conflict escalates further.
Hourly Analysis (1H)
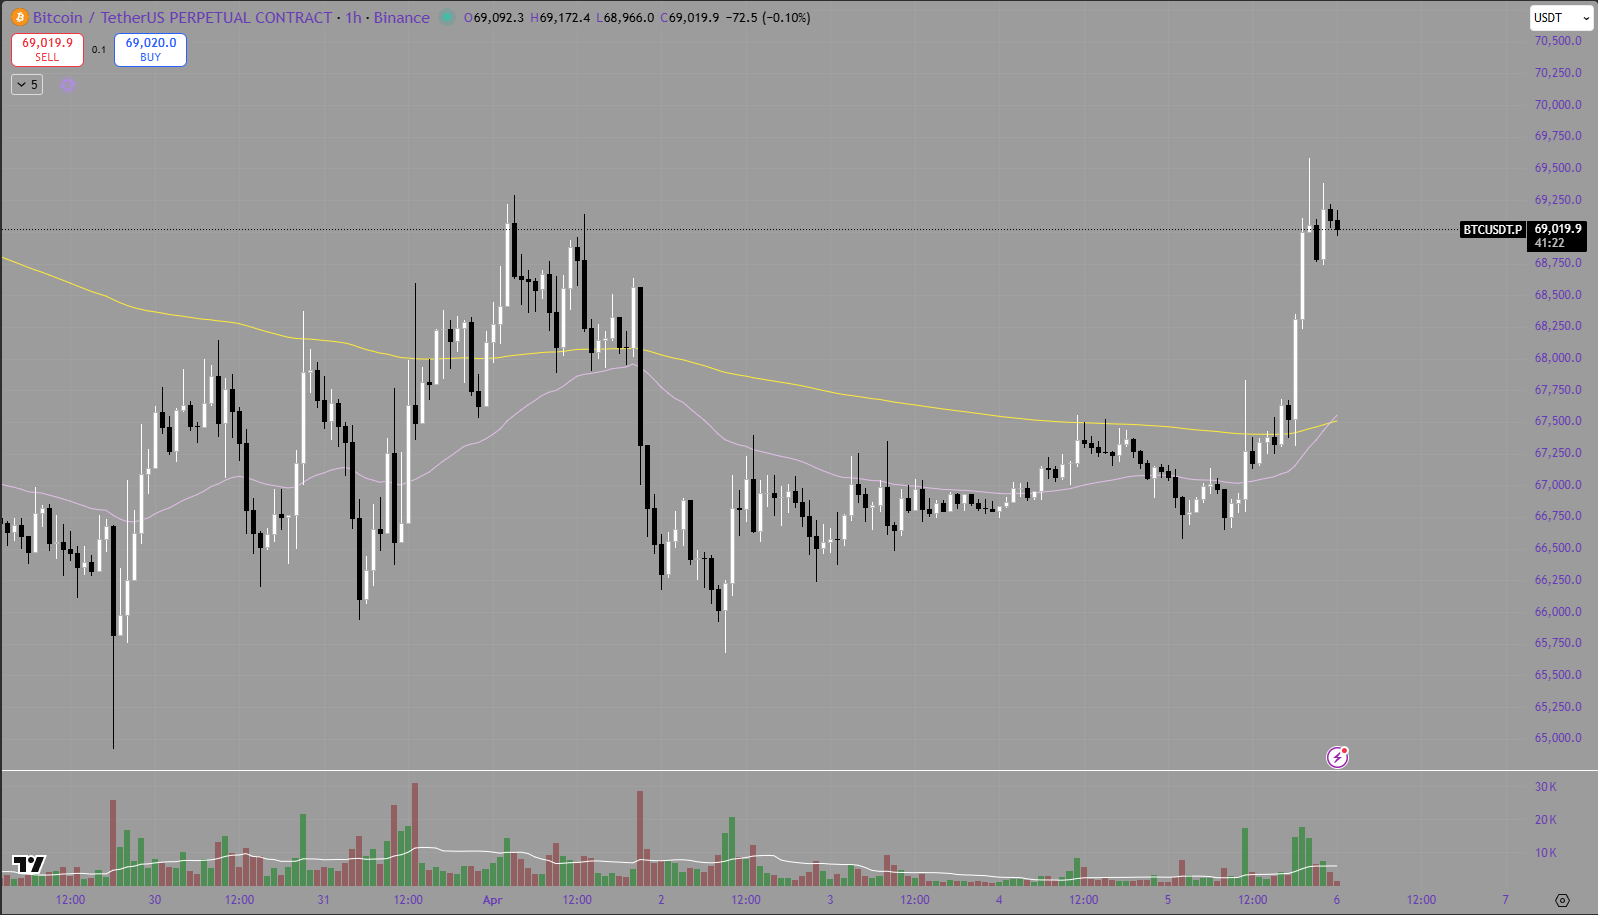
On the hourly chart, Bitcoin actually showed better composure than the macro backdrop might have implied. The week began with a market still trading reactively, but as the sessions developed BTC started to hold its local support more effectively and grind higher in a far more organised way. Instead of the fast liquidation candles that dominated earlier in the quarter, price action became more stair-stepped. We saw a reclaim from the mid-$66,000 region, then a sequence of higher intraday lows, followed by a more decisive lift into the upper-$67,000s and finally into the low-$69,000 area.
That improvement matters because it shows short-term buyers were willing to absorb weakness even while macro headlines remained hostile. The hourly structure shows a market that is trying to transition from pure reaction to controlled recovery. The 50 moving average gradually turned from resistance into a more supportive guide for much of the late-week move, while the 200 moving average overhead continued to act as a broader trend marker. BTC was able to move back toward that higher resistance area, but not fully break away from it.
The key feature of the hourly chart this week is that every pullback into the recovery leg was shallower than the last. That generally signals improving internal structure. Sellers still showed up whenever BTC approached the upper part of the range, but they were not able to completely erase the advance. This tells us the market has stopped behaving like a one-directional breakdown and has moved into a more balanced short-term environment.
At the same time, the hourly chart still carries a note of caution. The push into the low-$69,000 area looked strong, but not explosive. There was no true vertical breakout candle that changed the broader market psychology. Instead, the move looked more like a technical rally driven by improving short-term momentum, short covering, and dip buying. In an environment where geopolitical headlines can still move oil, bonds, the dollar, and broader equities very quickly, that means BTC remains vulnerable to sharp reversals if macro sentiment deteriorates again.
In simple terms, the hourly chart improved this week. Bitcoin built a better intraday structure, reclaimed important short-term levels, and traded with more confidence than in previous weeks. But the move still looks like a recovery leg inside a larger uncertain range, not yet a decisive breakout that can ignore macro risk.
Daily Analysis (1D)
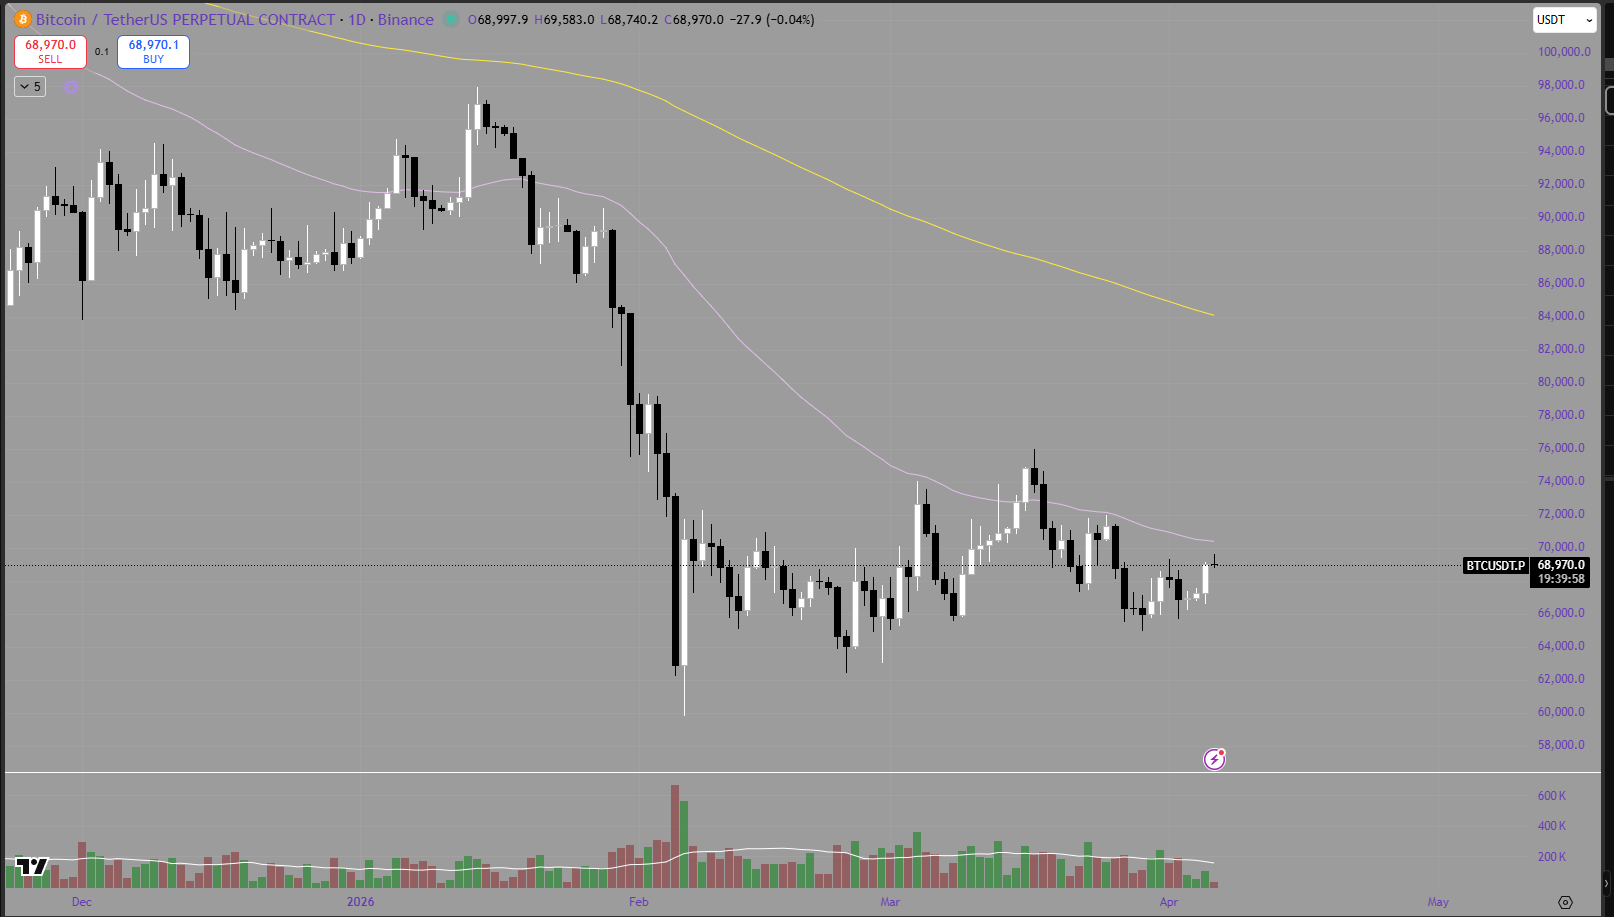
The daily chart remains the more important anchor, and it still tells a more cautious story than the hourly timeframe. Bitcoin is no longer in outright capitulation mode, which is a meaningful improvement, but the broader structure remains corrective. Price is still well below the major long-term resistance zone, and the long-duration moving average continues to slope lower. Until BTC can reclaim significantly more ground on a daily closing basis, the broader trend still has to be treated as a recovery attempt rather than a clean bullish reversal.
This week’s daily candle structure, however, was constructive in an incremental sense. Bitcoin managed to defend the mid-to-high $60,000 region again and finish the week pushing toward the top of its recent daily range. That tells us the market is trying to base. The big difference versus earlier in the quarter is that BTC is no longer making a sequence of fresh collapse lows. Instead, it has begun to form a more organised daily consolidation that allows for local recoveries and better-defined support.
That said, the daily chart also reflects the same problem seen on the hourly: the market can recover, but it has not yet proven it can sustain trend continuation through major resistance. The rebounds have improved in quality, but the larger bearish damage from previous months has not been fully repaired. Every push upward is still happening under the shadow of a falling higher-timeframe trend structure.
This is where the war in Iran and the broader commodity and bond reaction become especially important. Reuters reported that the conflict and disruption around the Strait of Hormuz have pushed Brent toward and above the $110 region, while also intensifying inflation fears and tightening financial conditions across markets. At the same time, defensive positioning has kept broader investors cautious, with capital rotating toward safer assets and away from clear risk-on behaviour.
For Bitcoin, that kind of backdrop has two conflicting effects. Over the longer term, persistent inflation pressure and geopolitical distrust can strengthen the appeal of alternative hard assets. But over the shorter term, higher oil, tighter policy expectations, and a more defensive asset allocation environment often make it harder for BTC to sustain strong trend rallies. That is why the daily chart still deserves respect. It is improving, but it is improving inside a macro regime that remains unstable and potentially inflationary.
Summary
Bitcoin had a better technical week than the broader news backdrop might have suggested. On the hourly chart, BTC managed to reclaim structure, build a more consistent sequence of higher lows, and push back toward the upper-$60,000 range. On the daily chart, the market continued to stabilise rather than break down further, reinforcing the idea that a broader base may be forming.
However, the macro environment remains the key swing factor. The ongoing war in Iran has continued to affect markets through elevated oil prices, inflation concerns, and a defensive tone across global assets. Reuters also reported that Trump has intensified his rhetoric toward Iran and threatened attacks on infrastructure if the Strait of Hormuz is not reopened, which adds another layer of risk because the conflict now appears closer to a sharper policy or military turning point than a peaceful de-escalation.
Looking ahead, the main high-impact red-folder events from the Crypto Craft calendar are:
US Fed Chair Powell Speaks
US ISM Services PMI
US Core PCE Price Index m/m
US Core CPI m/m
US CPI m/m
US CPI y/y
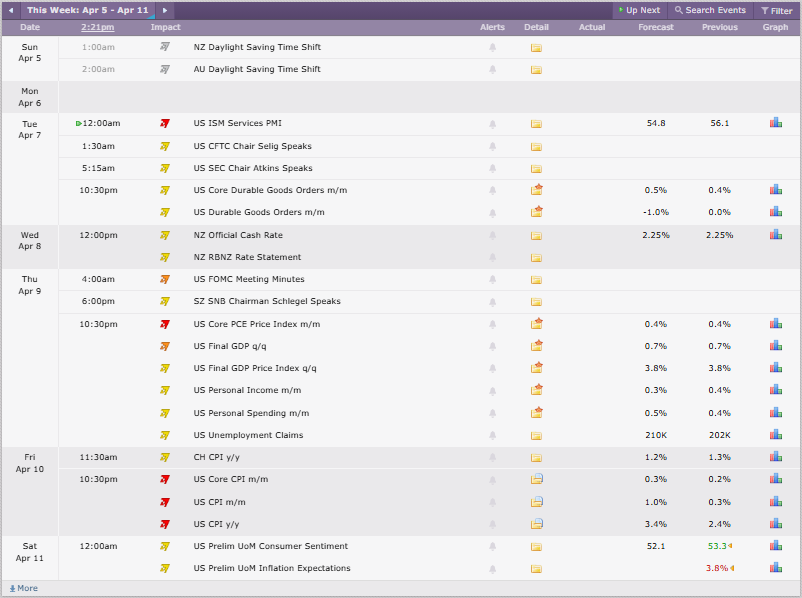
Credit: Crypto Craft
These are especially important because they sit right at the intersection of the two biggest market themes right now: geopolitical inflation risk and central bank sensitivity. If Powell sounds hawkish or inflation data surprises to the upside, Bitcoin may struggle to extend the recovery and could fall back into a more defensive range. If inflation prints softer and policy language is less restrictive, BTC may finally have the room to push beyond the current recovery structure.
For now, Bitcoin looks technically healthier than it did a few weeks ago, but the rally still needs confirmation. The charts are improving, yet markets remain one serious geopolitical headline or one hot inflation print away from renewed volatility.