
Weekly Bitcoin Price Analysis & Forecasts6th April - 12th April 2026
Bitcoin spent the week of 6th April to 12th April trading in a relatively controlled but still cautious fashion, with price holding above the recent recovery lows while struggling to fully break away into a stronger trend continuation. Compared with the panic and liquidation-driven conditions seen earlier in the quarter, this was a steadier week. However, the market still looked more like it was consolidating and rebuilding rather than confidently entering a new impulsive uptrend.
The broader macro backdrop continues to matter a great deal here. The ongoing war involving Iran has remained a major influence on global market sentiment, particularly through oil supply concerns, inflation fears, and a broader defensive tone across financial markets. Reuters reported this week that global markets have stayed sensitive to the conflict, with oil remaining elevated and investors becoming more cautious as the U.S. escalated pressure on Iran after failed peace efforts.
That has a direct effect on Bitcoin. Higher oil prices raise the risk of sticky inflation, while stronger demand for defensive assets such as bonds tends to signal reduced risk appetite across equities and crypto. Reuters also noted that inflation concerns tied to rising gasoline and energy costs have reduced expectations of quick rate cuts, which is exactly the kind of backdrop that can slow risk-asset momentum.
There is also good reason for added caution. The war appears to be moving toward another potentially decisive phase. Trump has used social media and public statements to escalate pressure on Iran, including threats tied to the Strait of Hormuz and Iranian infrastructure, which increases the chance of sudden headline-driven volatility across oil, bonds, equities, and crypto.
From a technical point of view, Bitcoin’s charts reflect that tension well. The hourly chart improved enough to suggest short-term buying interest is still active, while the daily chart shows the market trying to stabilise after the broader correction. But neither timeframe is yet fully free of macro risk.
Hourly Analysis (1H)
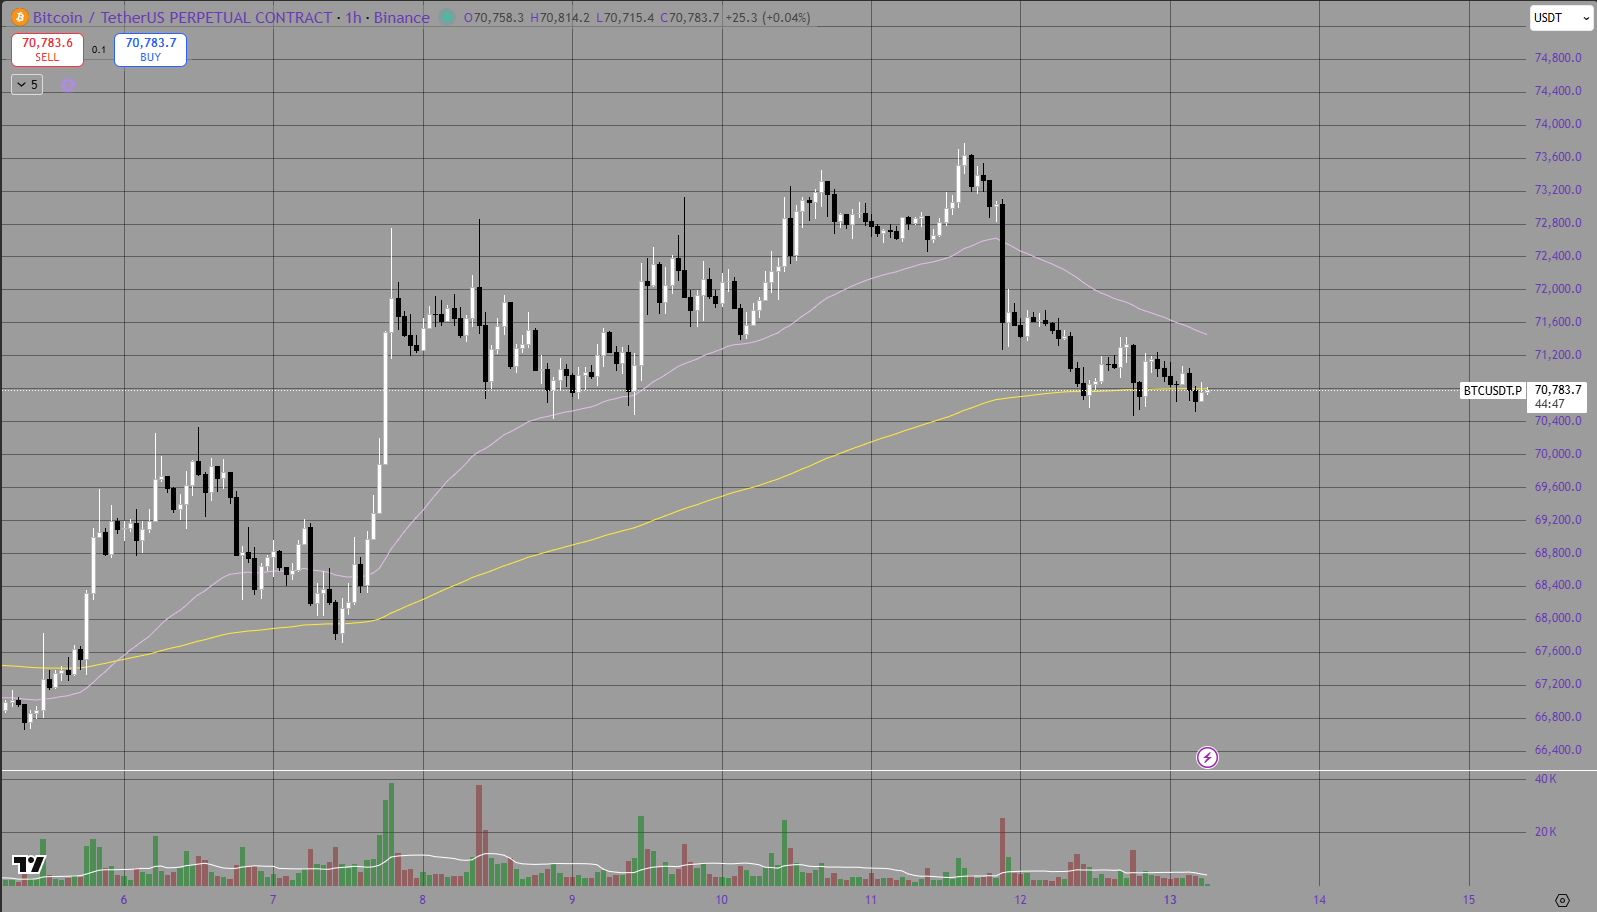
The hourly chart offered the clearest signs of improvement this week. Price action moved in a more constructive way than in prior periods, and the market showed a better ability to defend pullbacks instead of instantly rolling over.
A key feature of the chart is how Bitcoin responded around the 50 EMA, which is the purple line. During the earlier part of the week, price traded with better short-term momentum and stayed constructive while holding around or above that moving average. That generally suggested that buyers were willing to support dips and keep the short-term structure intact.
The 200 EMA, shown by the yellow line, remained the broader guide for the medium-term trend. On the hourly, BTC managed to hold above it and spend most of the week trading on the stronger side of that level, which is encouraging. When price can hold above the 200 EMA while the 50 EMA begins to flatten or slope upward, it often signals that the market is at least attempting to transition from recovery into a more sustainable trend-building phase.
The strongest portion of the week came during the move into the low-$73,000 region. That breakout leg had decent momentum and showed buyers were still prepared to chase price higher once intraday resistance gave way. However, once BTC reached that higher zone, it stalled. Instead of clean continuation, the market began to retrace and drift back toward the mid-$70,000 area.
That pullback is important. It tells us the market is still treating rallies as opportunities to take profit rather than as the start of a fresh expansion phase. Sellers were clearly active once BTC entered higher intraday supply.
Into the latter part of the week, price rotated lower and settled back near the $70,500 to $71,000 region. Even though that represented a loss of momentum from the highs, the decline was still more controlled than the sharp breakdowns seen earlier in the quarter. Bitcoin did not immediately collapse; instead, it moved back into a more neutral short-term structure.
The main hourly takeaway is that BTC showed:
stronger dip-buying than in previous weeks,
a successful hold above the hourly 200 EMA for much of the move,
a constructive interaction with the hourly 50 EMA,
but still not enough strength to hold a breakout into the low-$73,000s.
So, the hourly chart improved, but it improved into resistance. That keeps the short-term tone constructive, yet still fragile.
Daily Analysis (1D)
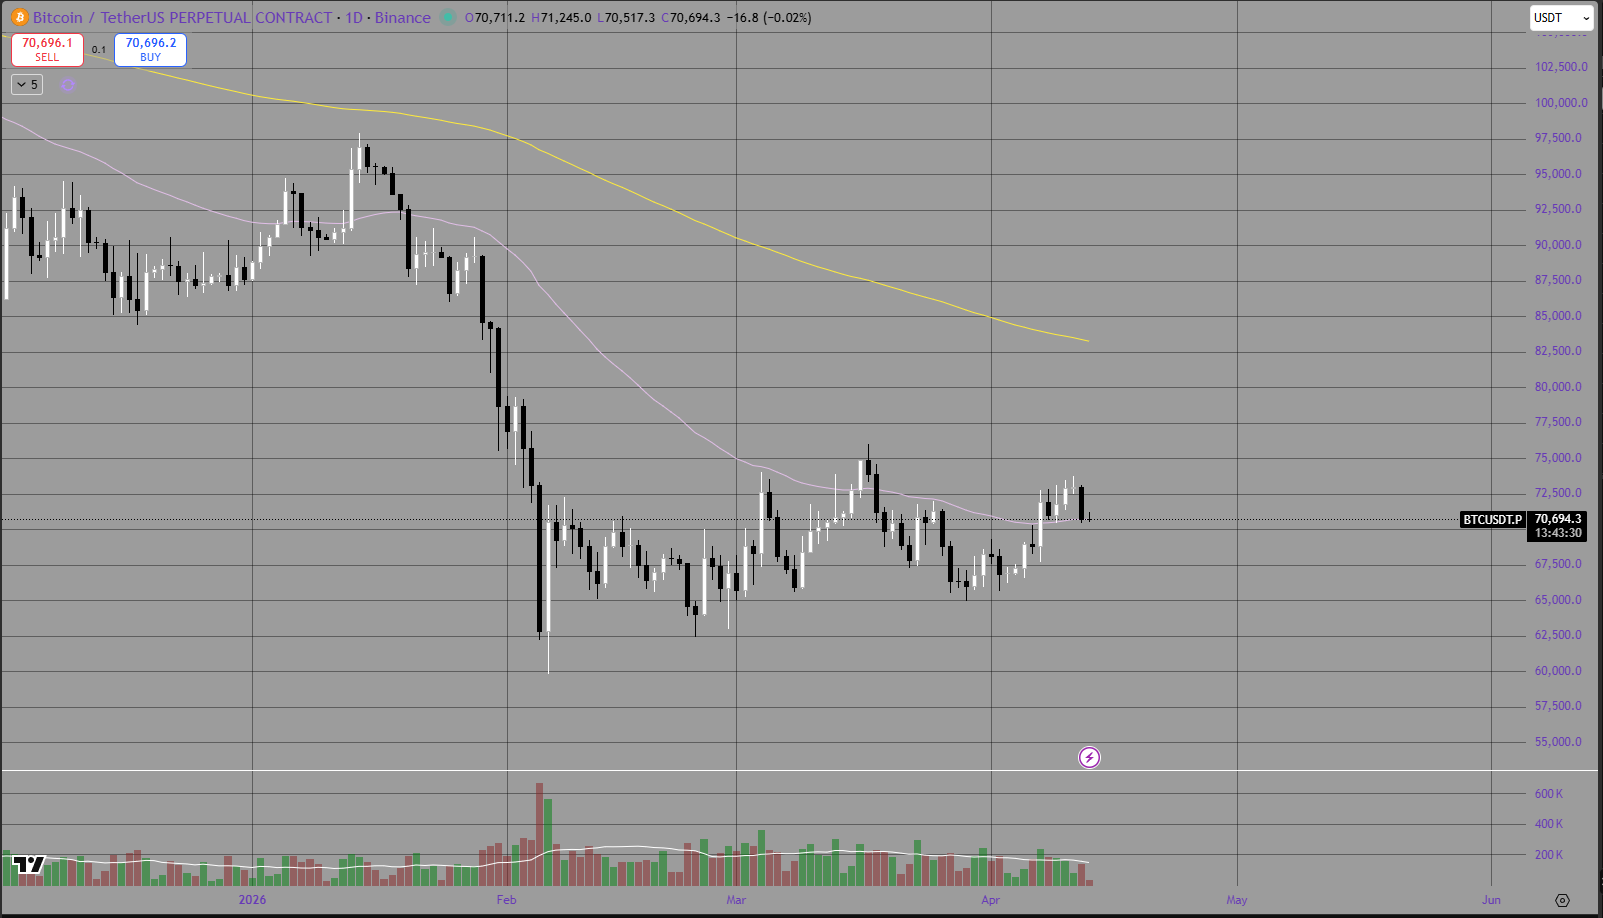
The daily chart remains more cautious than the hourly and gives a better sense of the bigger picture. Bitcoin is trying to recover, but the broader structure still reflects a market healing from a substantial correction rather than one already in a renewed macro uptrend.
The most important observation on the daily is that BTC is still trading below the daily 50 EMA and well below the daily 200 EMA. Since the purple line is the 50 EMA and the yellow line is the 200 EMA, the chart clearly shows that price remains underneath both key higher-timeframe trend markers. That means the macro structure has not yet turned bullish.
Even so, the daily chart has improved in one major respect: Bitcoin has stopped behaving like a market in freefall. Earlier price action was defined by aggressive breakdown candles and fast liquidation moves. Over recent weeks, that has shifted into a more controlled consolidation. BTC is now spending time building a base rather than simply cascading lower.
This week’s daily candle structure reinforced that process. Price held the upper end of its recent recovery range and was able to post a positive week, even if the gains were not explosive. That suggests the market is at least attempting to form a floor in the high-$60,000 region.
However, the limitations are still obvious:
price remains below the daily 50 EMA,
the daily 50 EMA is still trending downward,
the daily 200 EMA remains far overhead,
and Bitcoin has not yet reclaimed the higher breakdown zones from earlier in the quarter.
That means the daily chart is best described as a recovery inside a broader corrective structure.
This is where the macro story around Iran, oil, and bonds matters again. Reuters reported that the conflict has kept oil elevated and increased broader economic uncertainty, while also causing investors to rethink how quickly central banks can ease policy if inflation stays firm. That is exactly the kind of backdrop that can keep Bitcoin trapped in a recovery phase longer than bulls would like.
In addition, the increasingly aggressive rhetoric from Trump around Iran raises the risk of another headline shock. Reuters reported that Trump announced a naval blockade after peace talks collapsed and warned of further action, which reinforces the possibility that markets may still swing sharply on geopolitical developments.
So while the daily chart has definitely stabilised, it still needs a lot more work before it can be described as structurally bullish.
Summary
Bitcoin had a constructive but cautious week. On the hourly chart, BTC managed to hold a healthier short-term structure, stay largely above the hourly 200 EMA, and use the 50 EMA as a more supportive guide before stalling at higher resistance. On the daily chart, the market continued its repair process and avoided another major breakdown, but it still trades below both the daily 50 EMA and the daily 200 EMA, which keeps the broader structure corrective.
The macro backdrop remains the main swing factor. The ongoing war involving Iran continues to affect markets through elevated oil prices, inflation concerns, and a more defensive investor tone. Reuters reported that oil surged above $100 after the collapse of U.S.-Iran peace efforts and that broader markets have become increasingly sensitive to energy disruption and inflation risk. Rising oil and stronger bond demand are important because they tend to weigh on broader risk appetite, which in turn can limit Bitcoin’s ability to sustain stronger upside follow-through.
There is also reason for extra caution as the war appears to be approaching another decisive stage. Trump’s social-media messaging and public escalation around Iran and the Strait of Hormuz have increased the risk of sudden macro volatility if the situation deteriorates further.
Looking ahead, the main high-impact events from the Crypto Craft calendar that stand out are the red-folder U.S. inflation releases:
US Core PPI m/m
US PPI m/m
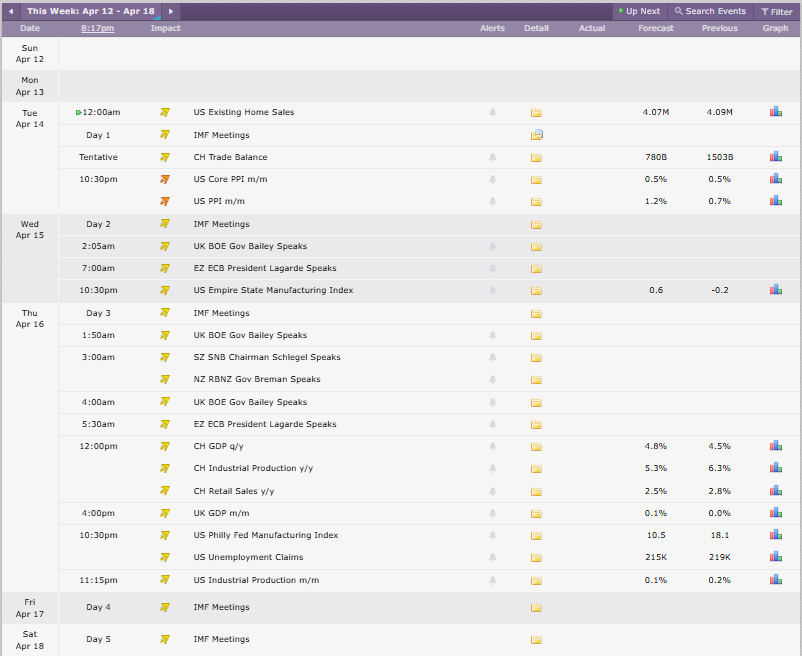
Credit: Crypto Craft
These are especially important because producer inflation can shape expectations for broader inflation pressure and Federal Reserve policy. If these come in hotter than expected, markets may become more cautious about the inflation outlook, particularly with oil already elevated due to the Middle East conflict. If they come in softer, Bitcoin may have more room to continue stabilising and potentially challenge the next higher resistance zone.
For now, BTC looks healthier than it did during the earlier breakdown phase, but the market is still in recovery mode. The charts are improving, yet geopolitical and inflation risks remain too important to ignore.