
Weekly Bitcoin Price Analysis & Forecasts23rd March - 29th March 2026
Bitcoin spent the week of 23rd March to 29th March 2026 continuing to trade inside a broader recovery attempt, but the market still lacks the strength required to fully shift sentiment back in favour of the bulls. While price has stabilised well from the earlier panic lows printed in February, this week showed that BTC remains vulnerable to macro pressure and headline-driven volatility. The market was able to recover intraday several times, but each push higher still lacked the conviction needed to break the broader structure decisively.
A large part of that hesitation continues to come from the broader macro backdrop. The ongoing war involving Iran has likely remained a significant influence on overall market sentiment. Geopolitical instability in the Middle East typically pushes investors into a more defensive posture, and that has flowed through into broader markets via stronger oil prices and firm bond demand. Higher oil prices raise concerns around inflation persistence, while stronger bonds signal that investors are still prioritising protection and safety over aggressive risk exposure. That combination is important for Bitcoin because it tends to create an awkward middle ground: BTC can still attract flows as an alternative asset over the longer term, but in the short term it often trades more like a risk-sensitive instrument when global liquidity concerns rise.
This week’s price action reflected exactly that kind of push and pull. Bitcoin was not collapsing, but it was also not trending cleanly. The hourly chart showed a market trying to reclaim momentum after a sharp intraday sell-off, while the daily chart continues to suggest that BTC is still in recovery mode inside a broader corrective structure rather than a fully renewed uptrend.
Hourly Analysis (1H)
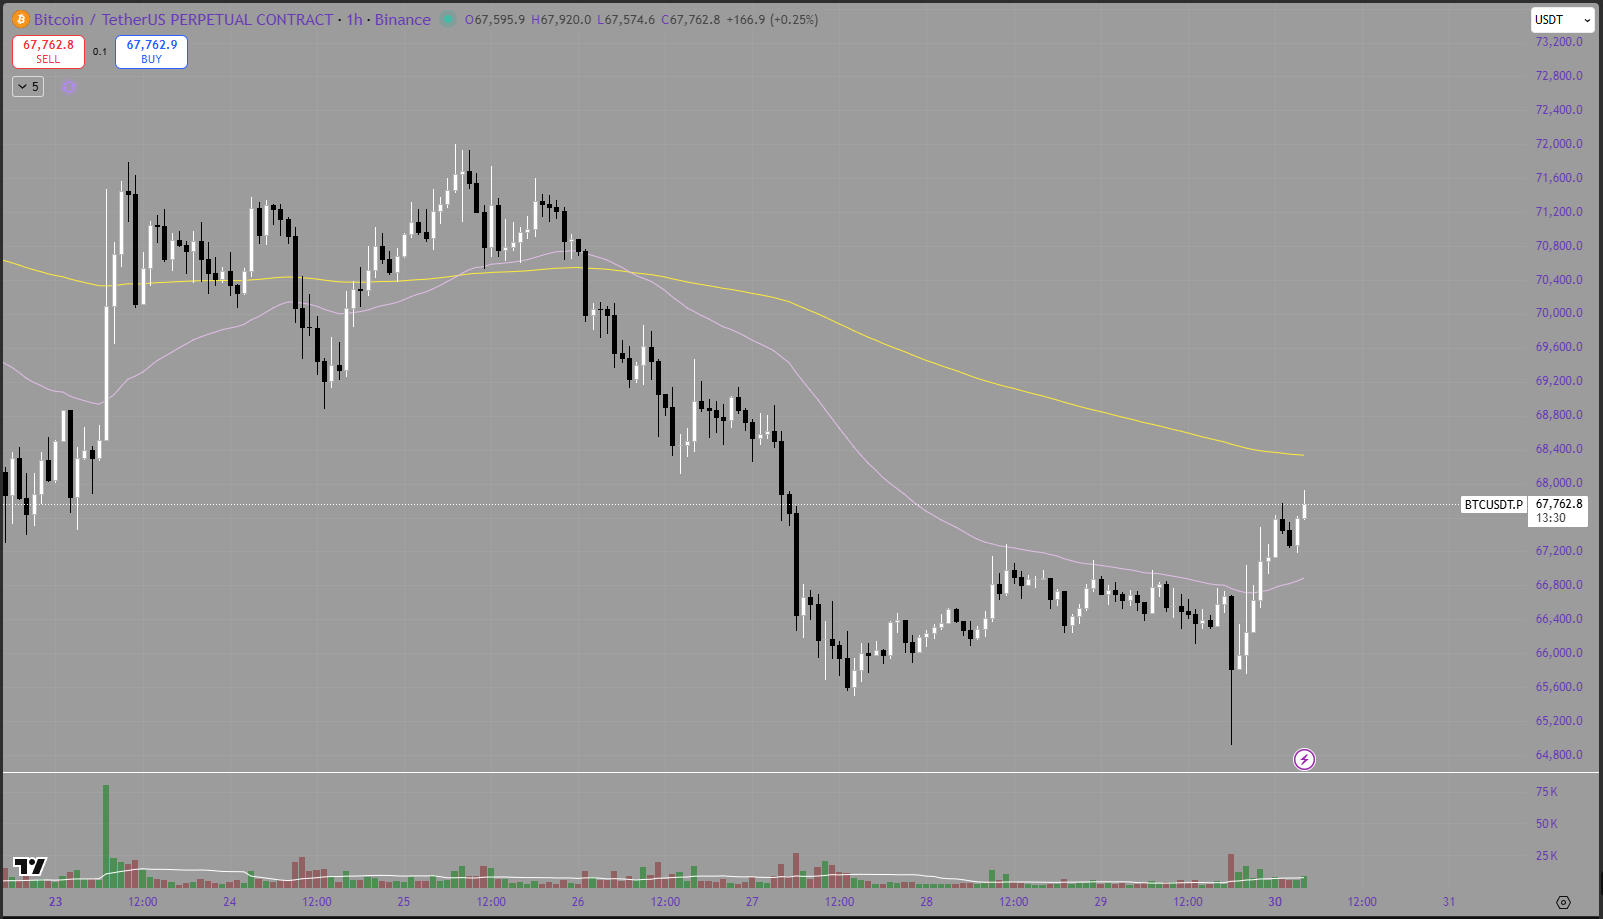
On the hourly timeframe, Bitcoin traded in a much more technical and reactive way this week. Early in the period, price showed some resilience and attempted to hold a short-term base, gradually grinding into higher levels. That part of the structure looked constructive, particularly because BTC was able to work its way back toward the upper end of its recent intraday range rather than immediately rolling over. The market looked as though it was beginning to build confidence again, and momentum improved enough for price to briefly test the low-to-mid $70,000 region.
That said, the move lacked strong follow-through. Once BTC pushed into that higher zone, the market started to lose energy. Sellers emerged, and the advance faded back into range. This was a recurring theme all week: Bitcoin could recover, but not yet sustain a proper breakout.
The middle of the week then showed a more obvious loss of momentum. Price began to rotate lower, slipping back beneath the shorter-term trend line and losing the more constructive posture that had been building. Instead of continuing to print higher highs and higher lows, BTC moved into a more mixed structure where rallies became shallower and price drifted back toward the middle and lower end of the weekly range.
What made the hourly chart especially interesting was the late-week flush lower followed by a recovery. Price dropped sharply into the high-$60,000 region, briefly trading with a much more aggressive bearish tone before buyers stepped in. That rebound matters because it shows there is still meaningful dip demand underneath the market. The bounce was not random either. It came after a fairly emotional downside extension, which often signals that weaker hands were being shaken out and short-term liquidity was being cleared before price stabilised.
From a structure perspective, the key hourly takeaways were:
Bitcoin initially tried to extend its recent recovery, but failed to hold its upper breakout zone.
Short-term momentum weakened as price slipped back below near-term support.
The sell-off into the back end of the week looked more like a fast liquidation event than the start of fresh panic.
Buyers responded well to the lower prices, pulling BTC back toward the middle of the range.
The most important level on the hourly chart now appears to be the broader high-$60,000 area. This zone continues to act as a pivot for sentiment. When price trades above it, BTC looks like it is stabilising. When price loses it, the market quickly feels heavier and more reactive.
The hourly chart therefore remains balanced but fragile. It is strong enough to avoid outright collapse, yet still too weak to confirm a clean directional breakout.
Daily Analysis (1D)
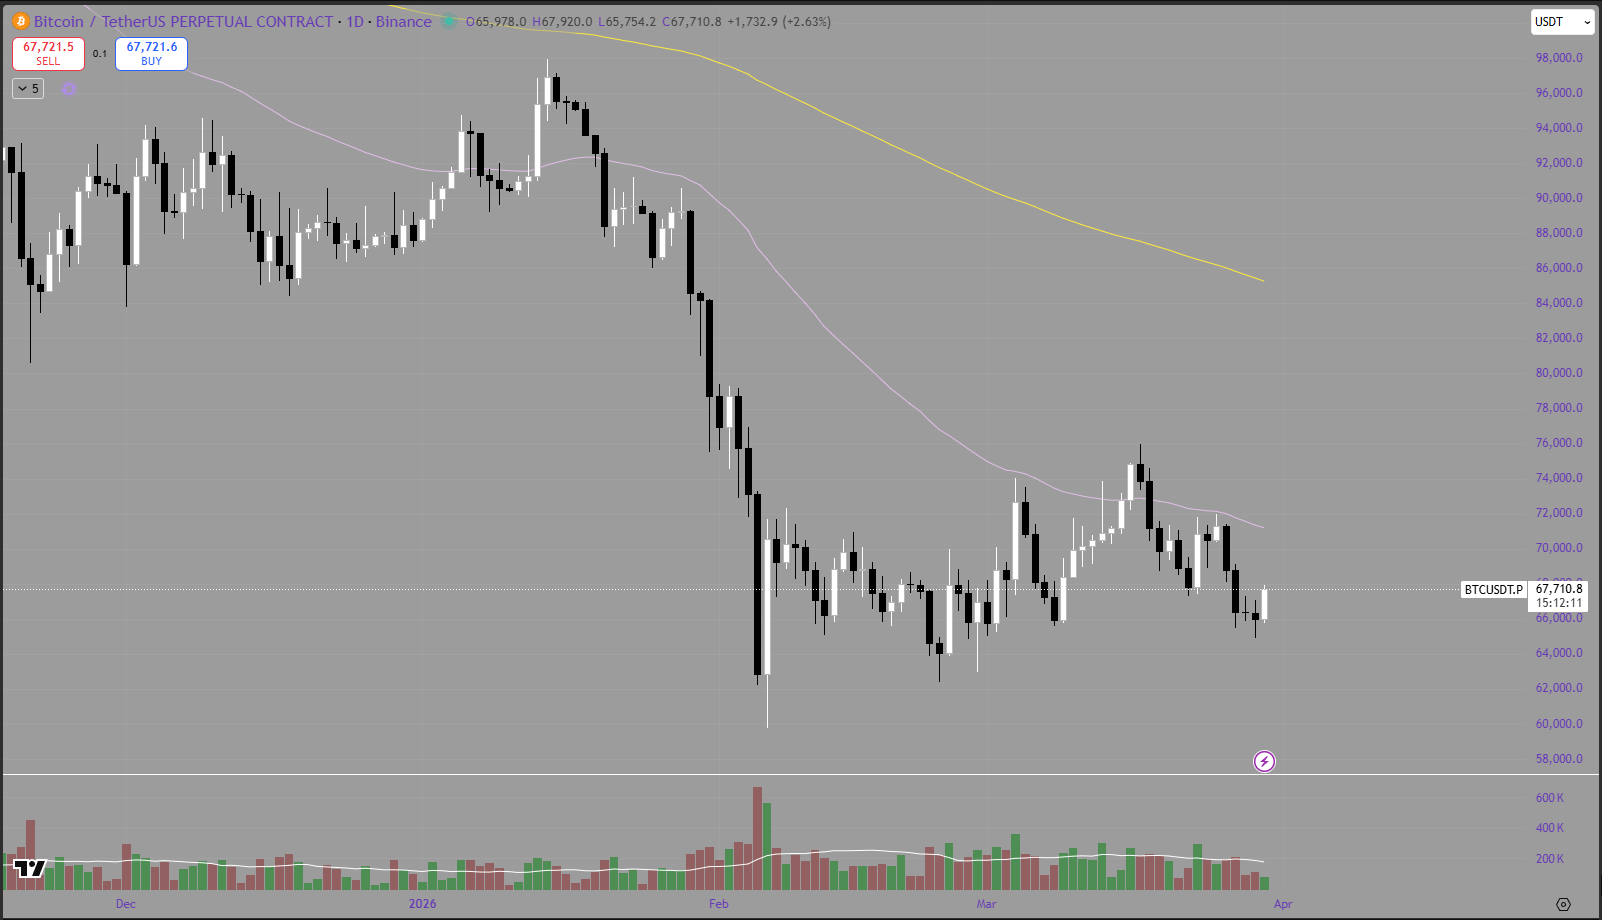
The daily chart keeps the larger picture much more grounded. Although the hourly chart shows tradable swings and short-term recovery attempts, the daily timeframe still tells the story of a market trying to recover from a deep correction.
Bitcoin remains below its larger trend resistance, and the long-term moving average is still sloping lower. That alone is enough to keep the broader structure cautious. Until BTC can reclaim and hold above those higher daily resistance zones, the market will continue to be viewed as corrective rather than fully bullish.
That said, the daily chart is no longer in outright breakdown mode. The massive liquidation structure seen earlier in the quarter has given way to a more organised repair process. Price is now oscillating inside a defined recovery range rather than cascading vertically lower. This is an important difference. Markets that are still breaking down tend to reject every bounce aggressively and continue setting fresh lows. Bitcoin has not done that recently. Instead, it has moved into a phase of rebuilding, where dips are being bought more actively and downside extensions are not yet producing the same kind of panic follow-through.
This week’s daily candle structure reinforces that idea. BTC was able to defend lower areas again and recover off the lows, which suggests the market is still trying to form a broader floor. The problem is that the upside remains capped. Every time Bitcoin tries to lift more meaningfully, it still runs into overhead resistance and fades back into the range.
That creates a daily structure that can best be described as an early recovery inside a bearish macro shell. The market is trying to repair itself, but it has not yet broken enough resistance to transition into a confident trend reversal.
This is also where the broader macro backdrop matters. The ongoing war involving Iran has likely kept broader investors cautious. Rising oil prices feed directly into inflation concerns, and when inflation risk stays elevated, markets become more sensitive to central bank policy. At the same time, higher bond prices reflect a market that still wants safety. For Bitcoin, that means even constructive technical developments can struggle to turn into strong trend continuation if traditional markets remain defensive.
So while the daily chart is clearly healthier than it was during the worst of the sell-off, it is still in a proving phase. Bulls have made progress, but not enough to fully reclaim control.
Broader Macro Backdrop: Iran, Oil, Bonds, and Risk Appetite
It is important to frame Bitcoin’s weekly movement within the wider macro environment, because BTC is not trading in isolation.
The ongoing war involving Iran has likely contributed to broader market uncertainty for several reasons:
1. Oil supply concerns and higher inflation risk
Conflict in the Middle East tends to push energy markets higher because traders begin pricing in supply disruptions or transport risk. Higher oil prices then filter into global inflation expectations, which can complicate central bank policy decisions and weigh on risk assets.
2. Flight to safety through bonds
When geopolitical uncertainty rises, investors often rotate into government bonds. Rising bond prices usually signal defensive positioning. This can pressure higher-beta assets, including crypto, because it reflects capital becoming more cautious overall.
3. Pressure on broader equities and liquidity sentiment
If equities become more unstable and macro traders begin reducing risk, Bitcoin can get dragged into that volatility. Even when BTC’s long-term narrative remains strong, short-term price action can still behave like a macro-sensitive asset.
4. Conflicting impact on Bitcoin
Bitcoin does not always react in a straight-line way to geopolitical crises. Over the long term, higher inflation concerns and distrust in fiat systems can support BTC’s narrative. But in the short term, liquidity and positioning usually dominate. That means rising oil and rising bonds can actually create near-term pressure before any longer-term bullish narrative reasserts itself.
This week’s price action fits that framework well. Bitcoin was stable enough to recover, but not strong enough to fully ignore the broader macro headwinds.
Summary
Bitcoin spent the week of 23rd March to 29th March 2026 trading in a mixed but slightly constructive fashion. On the hourly chart, BTC initially pushed higher and tested stronger levels before losing momentum and falling back. The late-week sell-off into the high-$60,000s was then met with a solid recovery, suggesting buyers remain active on dips. That is constructive, but the market still lacks the conviction required for a clean breakout.
On the daily timeframe, Bitcoin continues to look like a market in recovery rather than a market in full trend reversal. The structure is no longer in panic mode, but BTC still trades below key long-term resistance and remains influenced by a difficult macro backdrop.
That macro backdrop remains important. The ongoing war involving Iran, combined with higher oil prices and stronger bond demand, continues to keep markets cautious. Higher oil raises inflation concerns, while firm bonds reflect defensive capital flows. For Bitcoin, that means every recovery attempt is still happening inside an environment where risk appetite can fade quickly.
Looking ahead, the key high-impact red-folder events from the Crypto Craft calendar are:
US Fed Chair Powell Speaks
US Flash Manufacturing PMI
US Flash Services PMI
US Average Hourly Earnings m/m
US Non-Farm Employment Change
US Unemployment Rate
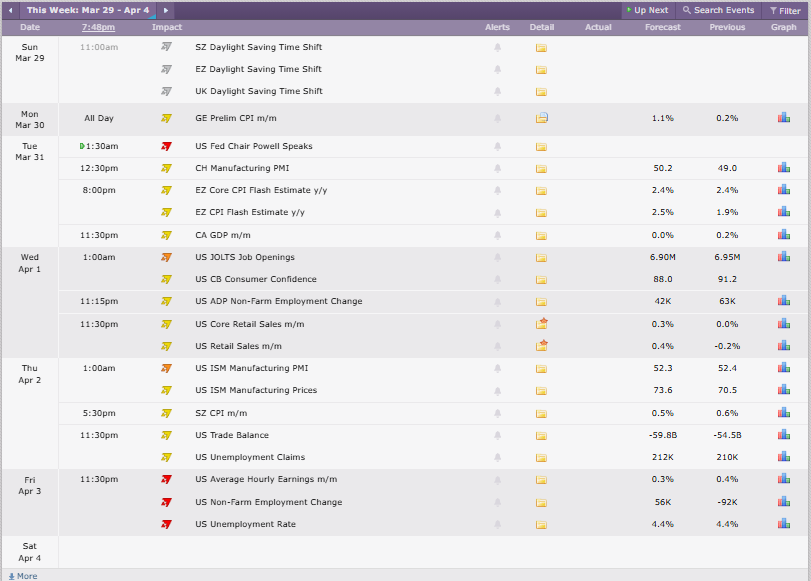
Credit: Crypto Craft
These events are likely to be the main macro drivers next week. Powell’s commentary could shape expectations around policy tone, while PMI data will give markets a read on economic momentum. The labour market releases at the end of the week may be the biggest catalyst of all, especially if wages or payrolls surprise materially.
If the data comes in strong, markets may interpret that as keeping policy tighter for longer, which could weigh on risk assets and cap Bitcoin’s recovery. If the data softens, BTC may have room to continue stabilising and potentially make another attempt at reclaiming higher resistance.
For now, Bitcoin remains in a rebuilding phase. The structure is improving, but the market still needs a stronger macro tailwind and a clear technical breakout before the broader tone can turn confidently bullish.