
Weekly Bitcoin Price Analysis & Forecasts the 17th August - 23rd August 2026
Following on from last week’s consolidation around the low-$60,000 region, Bitcoin delivered one of its strongest technical moves in several months during the week of 17th August to 23rd August 2026.
BTC broke aggressively out of the $63,000 to $65,000 range and surged through several resistance levels, eventually reaching the upper-$70,000 region. Importantly, this move also pushed Bitcoin decisively above both the daily 50 EMA and 200 EMA, materially improving the broader technical structure.
After reaching close to $79,000, Bitcoin has spent the latter part of the week consolidating around $76,000 to $78,000. Rather than immediately retracing the breakout, buyers have continued to defend the higher range, which remains constructive.
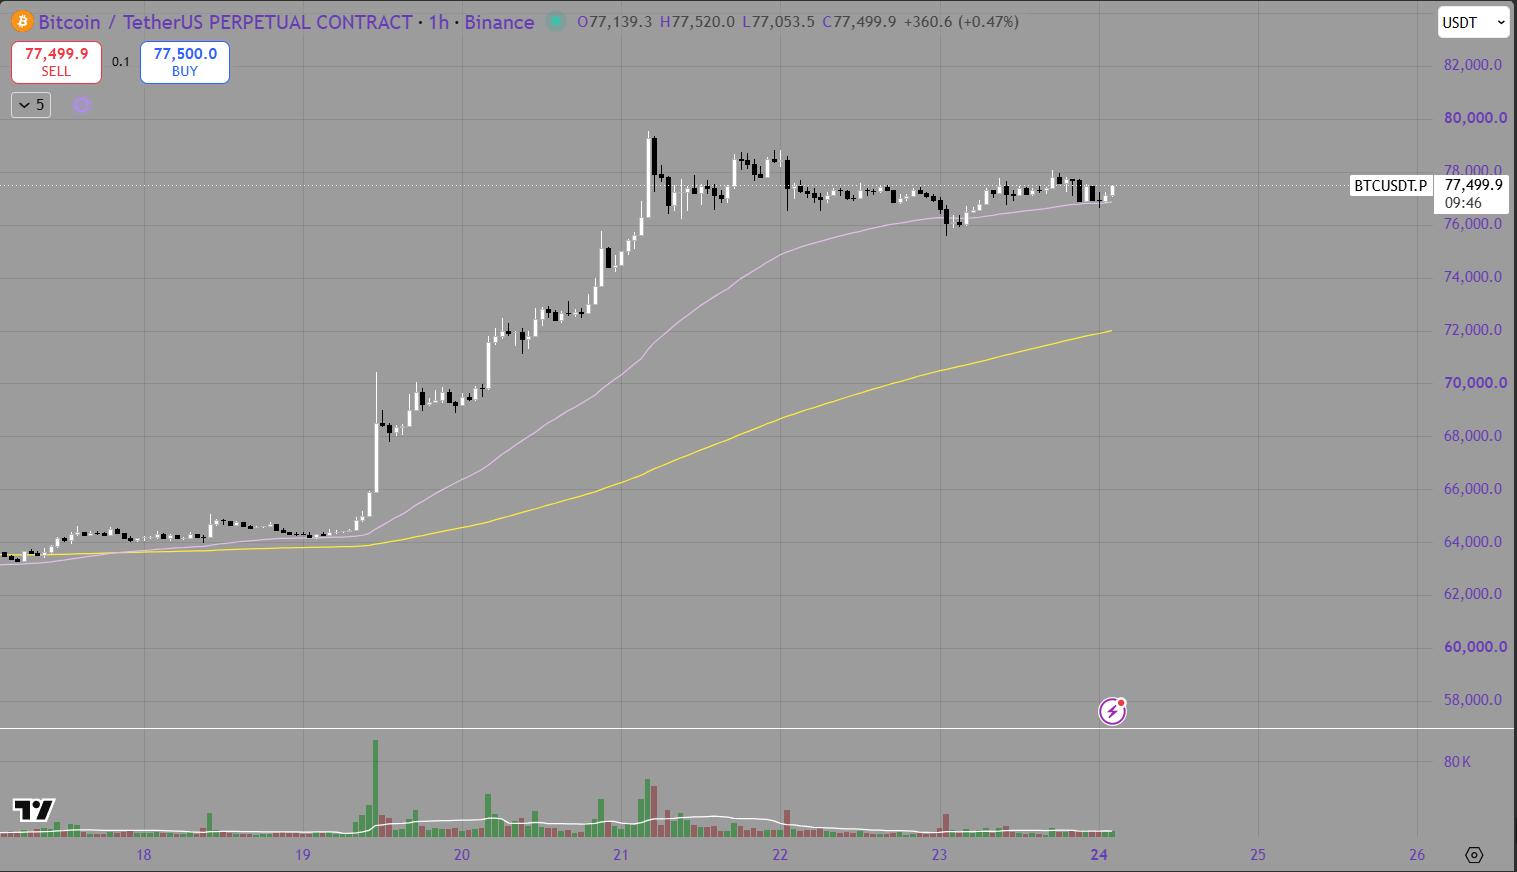
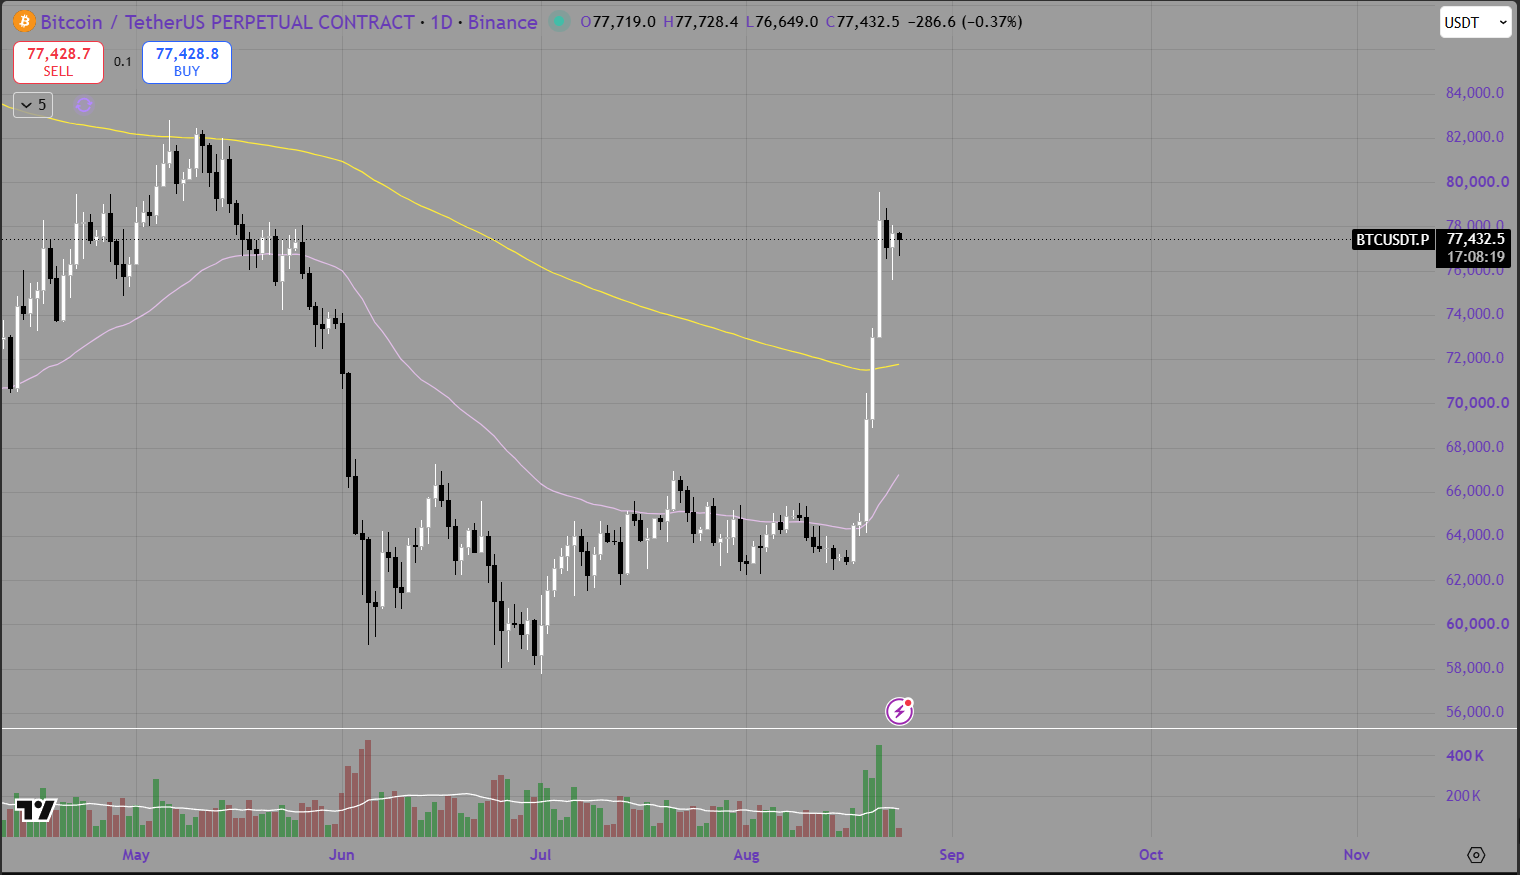
The purple line represents the 50 EMA, while the yellow line represents the 200 EMA.
Hourly Analysis
The hourly chart shows a dramatic change in momentum compared with recent weeks.
Bitcoin initially traded around $63,000 to $64,000 before breaking higher with significant volume. Once BTC moved through approximately $65,000, momentum accelerated rapidly.
Price pushed through $68,000, $70,000 and $72,000 with relatively limited resistance before another expansion carried Bitcoin into the $77,000 to $79,000 region.
The strength of the breakout is particularly important because Bitcoin did not simply spike higher and immediately reverse. Instead, BTC has spent several sessions consolidating around the upper-$70,000 region.
The hourly 50 EMA has now risen sharply toward the $76,000 to $77,000 area and is beginning to act as dynamic support. Bitcoin briefly tested below this region around the 23rd before recovering, showing buyers remain willing to defend pullbacks.
The first major resistance now sits around $78,000 to $79,000. A clean breakout above this region could open the door toward $80,000, followed by the previous major price area around $82,000.
On the downside, $76,000 to $76,500 becomes the first important support zone. Below this, $74,000 to $75,000 would represent a deeper but still relatively normal retracement following such a strong breakout.
For now, the hourly structure remains bullish while Bitcoin continues holding above its rising 50 EMA.
Daily Analysis
The daily chart provides the most significant development this week.
Bitcoin has decisively reclaimed both the daily 50 EMA and the daily 200 EMA after spending several months below them.
The breakout began from approximately $64,000 and rapidly carried BTC above the 50 EMA before breaking directly through the yellow 200 EMA around the $71,000 to $72,000 region.
This represents a major technical improvement.
The daily 200 EMA had previously acted as one of the strongest indicators of the broader bearish structure. Moving back above this level shifts the market from a prolonged recovery phase toward a potentially more established bullish reversal.
Volume also increased substantially during the breakout, adding further confirmation to the move.
Bitcoin is now trading around $77,000, comfortably above both moving averages. The next important resistance sits between approximately $78,000 and $80,000, followed by the previous major highs around $82,000.
The key question is now whether BTC can turn the breakout zone into support.
The $71,000 to $72,000 region, where the daily 200 EMA currently sits, has become a major structural level. A future pullback into this region followed by a strong reaction would provide further confirmation that the broader trend has changed.
In the shorter term, $74,000 to $76,000 should provide support if Bitcoin experiences a deeper retracement.
Overall, the daily chart is considerably stronger than it has been throughout recent months.
Summary
Bitcoin had an exceptionally strong week, breaking from the mid-$60,000 region and rallying into the upper-$70,000s.
More importantly, BTC has reclaimed both the daily 50 EMA and 200 EMA. This represents a major improvement in the broader market structure and separates this breakout from many of the weaker recovery attempts seen over recent months.
The hourly chart is now consolidating around $77,000 after the initial expansion, with the rising 50 EMA providing support underneath price.
Key levels to monitor include:
Immediate resistance: $78,000 to $79,000
Psychological resistance: $80,000
Major upside resistance: $81,000 to $82,000
Initial support: $76,000 to $76,500
Secondary support: $74,000 to $75,000
Major structural support: $71,000 to $72,000
Looking ahead, the main red-folder events shown on the Crypto Craft calendar are concentrated toward the end of the week:
US Fed Chairman Warsh Speaks
US Preliminary Benchmark Payrolls Revision
Jackson Hole Symposium
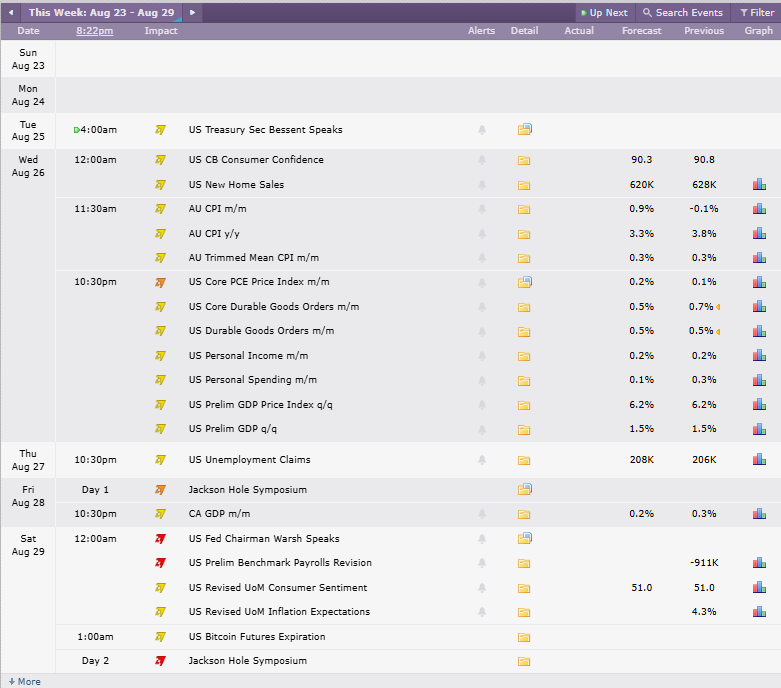
Jackson Hole is likely to receive particular attention from markets. Central-bank commentary surrounding inflation, economic growth and the future path of interest rates could influence bond yields, the US dollar and broader risk sentiment.
Fed Chairman Warsh's comments could therefore become an important volatility catalyst for Bitcoin, particularly following such a large technical breakout. A more dovish policy message could reinforce the bullish move, while unexpectedly hawkish commentary could trigger profit-taking across risk assets.
For now, the technical picture has changed considerably. Bitcoin is no longer simply attempting to recover from the June lows — it has broken through major daily resistance and reclaimed its key moving averages. Holding above $74,000 to $76,000 would keep the breakout structure intact, while a clean move through $79,000 to $80,000 could open the next leg toward the low-$80,000 region.
