
Weekly Bitcoin Price Analysis & Forecasts the 18th May - 24th May 2026
Following on from last week’s pullback from the low-$80,000 region, Bitcoin continued to trade in a more cautious but still constructive range through the week of 18th May to 24th May 2026. BTC has not yet reclaimed the stronger bullish momentum seen earlier in May, but the market has also avoided a deeper breakdown.
Price is currently sitting around the $77,000 region, with the hourly chart showing Bitcoin attempting to stabilise after a sharp intraday recovery. The daily chart remains the more important view, as BTC is still trading below the yellow 200 EMA, which continues to act as the larger resistance area. The purple 50 EMA is also still important, as it shows whether Bitcoin’s recovery structure is holding or beginning to weaken.
The key theme this week is balance. Bitcoin is not in full bullish continuation mode, but it is also not showing the same level of weakness seen during the major sell-off earlier in the year. Buyers are still defending key areas, but the market needs a stronger reclaim above resistance before momentum can properly shift back in favour of the bulls.
Hourly Analysis (1H)
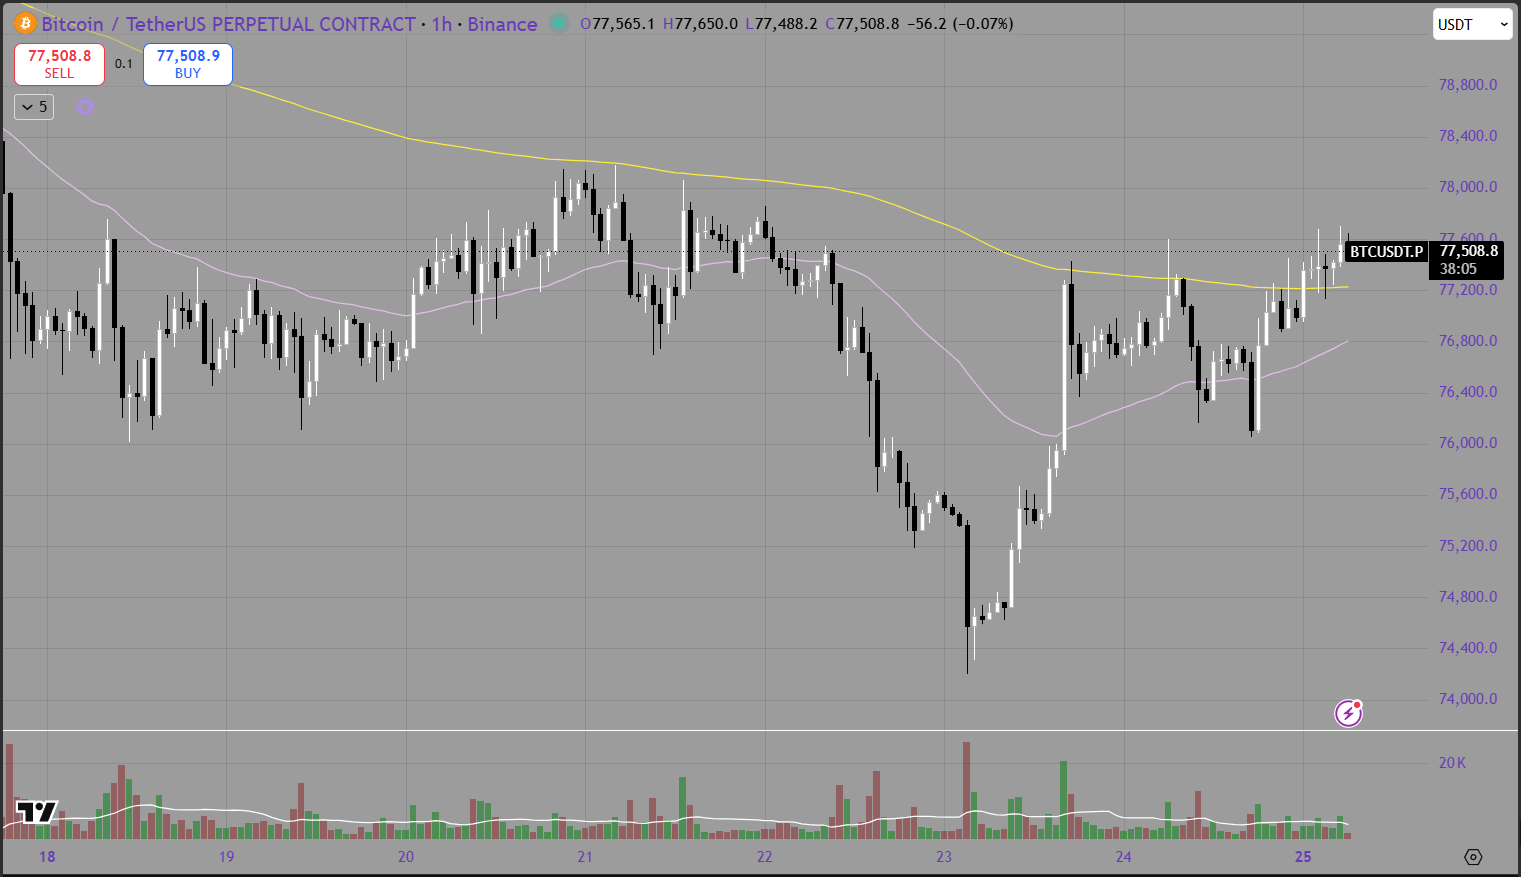
The hourly chart shows Bitcoin trading with mixed momentum throughout the week. BTC started the period around the $77,000 to $78,000 region before chopping sideways and eventually selling down into the mid-$74,000 area. This move lower showed that sellers were still active after last week’s rejection from the low-$80,000s.
The important part of the hourly chart is the recovery that followed. After dipping into the $74,000 region, BTC bounced strongly and pushed back toward $77,500. This was a positive reaction and showed that buyers were still willing to step in at lower prices.
However, Bitcoin is now testing a key decision area. Price is sitting close to the yellow 200 EMA on the hourly chart, and this level has acted as resistance during the recent move. The purple 50 EMA is now below price, which is constructive in the short term, but BTC still needs to hold above it and break clearly above the 200 EMA to confirm stronger momentum.
The $77,500 to $78,000 region is now the key short-term resistance area. If Bitcoin can break and hold above this zone, the next target becomes the $79,000 to $80,000 region. That would suggest the recent pullback was more of a reset rather than the beginning of another major leg lower.
On the downside, the $76,000 to $76,500 area is important support. If BTC loses that level, the market could retest the lower range around $74,500 to $75,000. For now, the hourly structure is improving, but it has not yet fully flipped bullish.
Daily Analysis (1d)
The daily chart shows Bitcoin still recovering from the larger downtrend that began earlier in the year. Price has bounced from the February and March lows and has built a more stable base, but the market is still trading below the yellow 200 EMA. This remains the biggest technical barrier.
Last week, BTC rejected from the low-$80,000 region, which lined up with a key resistance area on the daily chart. This week’s pullback has not completely damaged the recovery, but it has slowed momentum. Bitcoin is now sitting near the daily 50 EMA area, shown by the purple line, which makes this a key zone for trend repair.
If BTC can hold above the daily 50 EMA and continue building higher lows, the broader recovery remains intact. This would suggest the market is still preparing for another attempt at the daily 200 EMA. A clean break above the daily 200 EMA would be a much stronger bullish signal and could shift the market back into a more confident recovery phase.
However, if Bitcoin loses the daily 50 EMA and starts closing back below the mid-$70,000 region, the structure becomes weaker. That would suggest the low-$80,000 rejection was more significant and could open the door for a deeper retracement.
The daily chart is therefore neutral to cautiously bullish. The recovery is still alive, but Bitcoin needs to prove itself by holding current support and reclaiming higher resistance.

Summary
Bitcoin had a mixed week, with price pulling back from the previous low-$80,000 rejection before finding support and recovering back toward the $77,000 region. The hourly chart is showing signs of short-term repair, but BTC still needs to reclaim the hourly 200 EMA and break above the $77,500 to $78,000 area to confirm stronger momentum.
The daily chart remains the main focus. Bitcoin is still trading below the daily 200 EMA, which continues to act as the larger resistance level. The daily 50 EMA is now the key support area to watch. Holding above this level keeps the recovery structure alive, while losing it would weaken the bullish case.
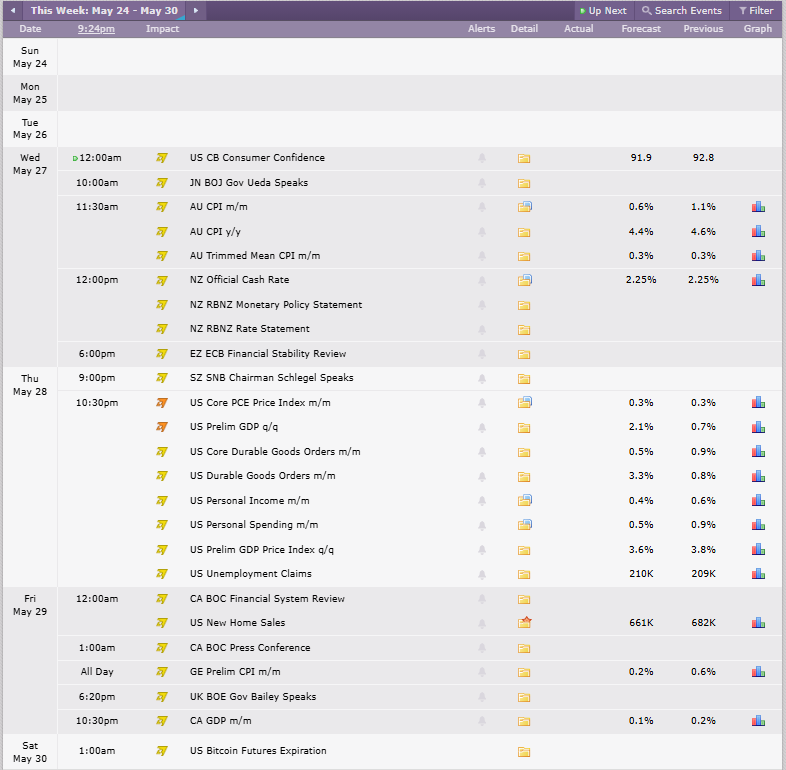
Looking ahead, there do not appear to be any major red-folder events in the Crypto Craft screenshot for the week ahead. However, the market should still be aware of several lower-impact events, particularly:
US CB Consumer Confidence
US Core PCE Price Index m/m
US Prelim GDP q/q
US Unemployment Claims
US New Home Sales
US Bitcoin Futures Expiration
Credit: Crypto Craft
While these are not marked as major red events, Core PCE is still worth watching because it can influence inflation expectations and Federal Reserve policy sentiment. Bitcoin may also see some additional volatility around futures expiration.
For now, Bitcoin remains in a recovery phase, but momentum has cooled. The bullish case improves if BTC can reclaim $78,000 and continue pushing toward $80,000. The bearish risk increases if price loses the $76,000 region and fails to hold the daily 50 EMA.
