
Weekly Bitcoin Price Analysis & Forecasts the 25th May - 31st May 2026
Following on from last week’s cautious recovery, Bitcoin struggled to maintain bullish momentum during the week of 25th May to 31st May 2026. BTC had previously attempted to stabilise around the $77,000 region, but this week saw price weaken further, with the hourly chart showing a clear move lower and the daily chart rejecting from the broader recovery range.
The market is still trading well above the major February lows, but the short-term structure has turned more defensive. Bitcoin has failed to reclaim the higher resistance zones near $80,000 to $82,000 and is now pulling back toward the lower-$70,000 region.
The key theme this week is whether this is simply another pullback within the broader recovery, or whether the rejection from the daily 200 EMA is beginning to develop into a deeper correction.
Hourly Analysis (1H)
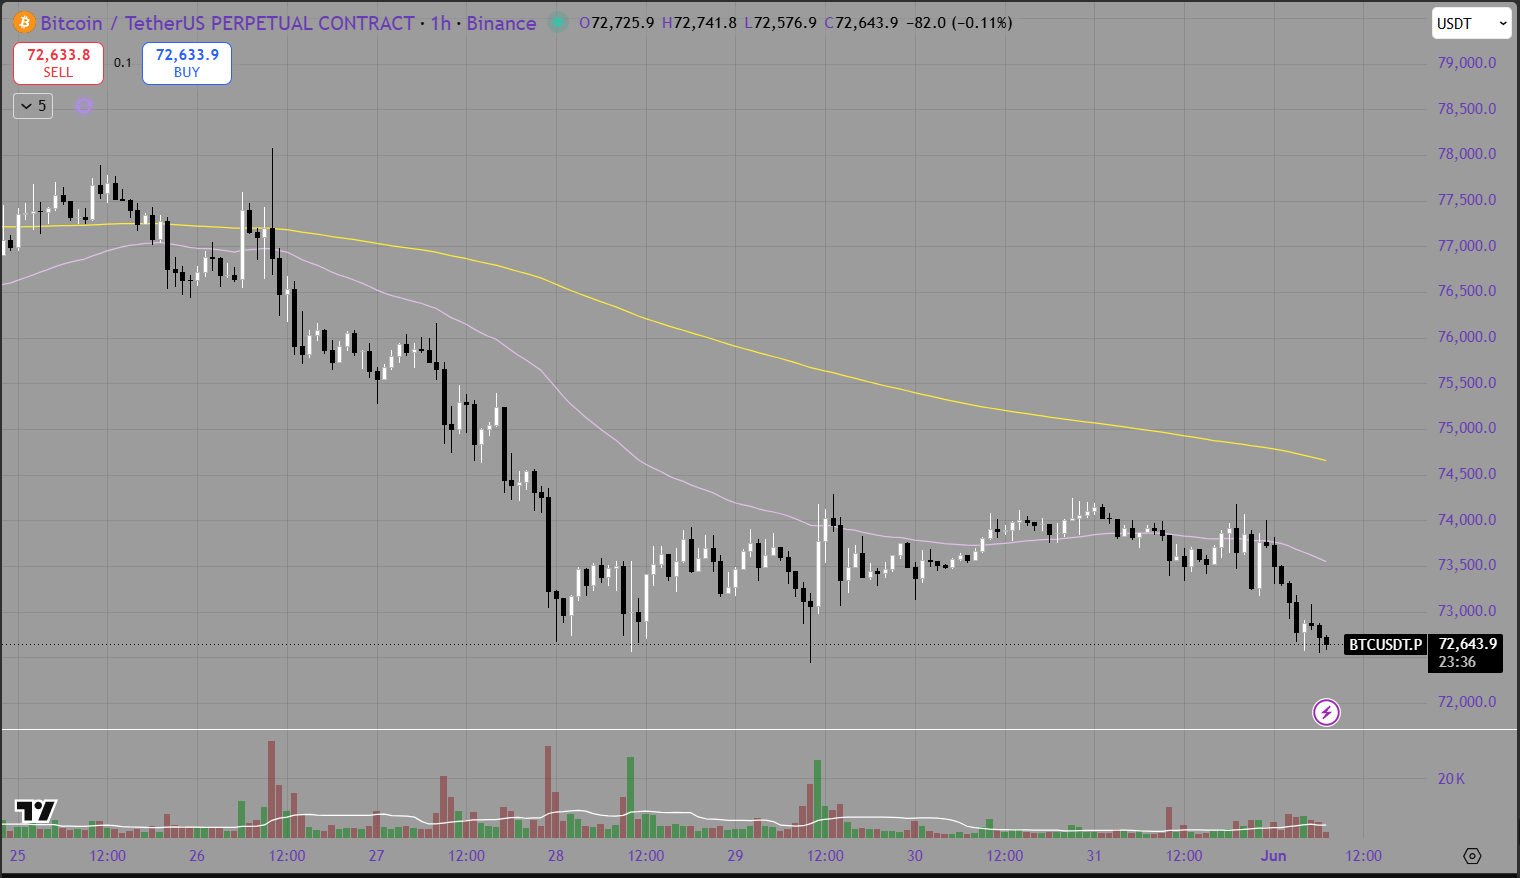
The hourly chart shows Bitcoin trending lower throughout the week. Price began around the mid-to-high $70,000 region before gradually losing momentum and breaking below short-term support.
The purple 50 EMA and yellow 200 EMA both acted as resistance during the week, with BTC failing to reclaim either level with strength. This is a sign that short-term momentum has shifted back toward sellers. Earlier in May, Bitcoin was trading above these moving averages during its recovery. This week, the opposite has occurred, with price staying below both and each bounce being sold.
BTC attempted to stabilise around the $73,000 to $74,000 region, but sellers continued to pressure the market lower. The move into the $72,000 area now becomes important, as this is where buyers need to step in to prevent another deeper leg down.
If Bitcoin can reclaim the $73,500 to $74,000 region, the hourly chart may begin to repair. From there, the next test would be the 50 EMA, followed by the larger resistance near the 200 EMA. However, if BTC continues to reject below these moving averages, the short-term trend remains bearish.
The key downside level to watch is around $72,000. A clean break below this area could open the door for a move toward $70,000, which would become the next major psychological support zone.
Daily Analysis (1D)
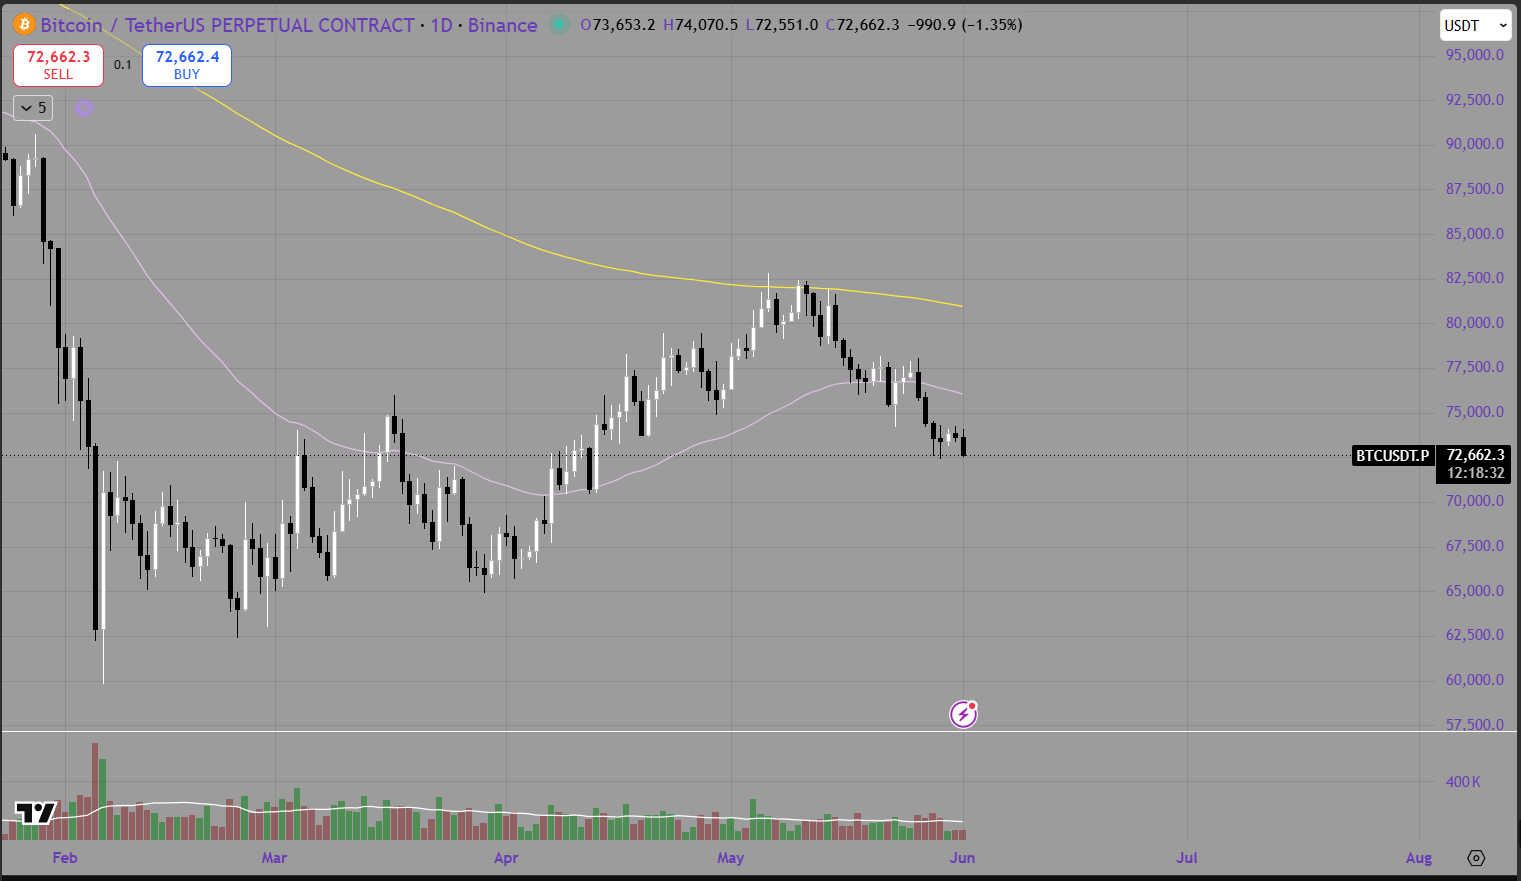
The daily chart shows a clearer picture of Bitcoin’s broader rejection. BTC had previously rallied from the February lows and pushed toward the $80,000 to $82,000 region, but that move has now lost momentum.
The yellow 200 EMA remains above price and continues to act as the major macro resistance level. Bitcoin failed to reclaim this level, which means the broader recovery has not yet confirmed into a full trend reversal. Until BTC can break and hold above the daily 200 EMA, the market remains in a recovery phase rather than a confirmed bullish trend.
The purple 50 EMA is now the key support and resistance guide. BTC is beginning to lose momentum around this area, and if price remains below it, the daily structure becomes weaker. A sustained close below the daily 50 EMA would suggest that sellers are regaining control and that Bitcoin may need to search for lower support before attempting another recovery.
The broader structure still shows that BTC has bounced significantly from the February lows, but the recent rejection is important. The market has now created a lower high beneath the daily 200 EMA, which is not ideal for bulls. For the recovery to remain healthy, Bitcoin needs to hold above the lower support zones and avoid a full breakdown back toward the mid-$60,000 region.
For now, the daily chart is neutral to bearish. The recovery is not completely broken, but momentum has clearly cooled.
Summary
Bitcoin had a weaker week, with price falling from the mid-$70,000 region toward the low-$72,000 area. The hourly chart is now bearish, with BTC trading below both the 50 EMA and 200 EMA. The daily chart also shows that Bitcoin has failed to reclaim the 200 EMA, keeping the broader market in a recovery phase rather than a confirmed bullish reversal.
The key technical takeaway is that BTC needs to reclaim the $73,500 to $74,000 area to begin repairing short-term structure. If price fails to do this, the next major area to watch is $72,000, followed by the psychological $70,000 level.
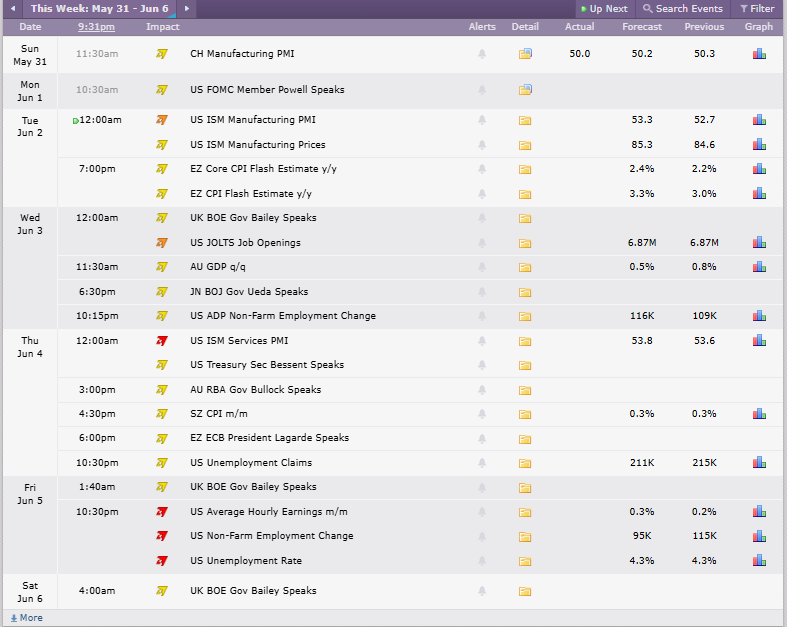
Looking ahead, the main red-folder events from the Crypto Craft screenshot are:
US ISM Manufacturing PMI
US ISM Services PMI
US Average Hourly Earnings m/m
US Non-Farm Employment Change
US Unemployment Rate
Credit: Crypto Craft
These events are important because they can directly influence inflation expectations, bond yields, and Federal Reserve policy expectations. Stronger labour or services data may keep pressure on risk assets if markets price in tighter financial conditions for longer. Softer data could support Bitcoin if it lowers rate pressure, but weak data may also raise concerns about broader economic slowing.
For now, Bitcoin remains under short-term pressure. The larger recovery from the February lows is still visible, but the rejection from higher levels shows that buyers have not yet regained full control. BTC needs to reclaim key moving averages and rebuild above $74,000 to shift momentum back in favour of the bulls.
