
Weekly Bitcoin Price Analysis & Forecasts5th January – 11th January 2025
Following on from last week’s consolidation and holiday-thinned liquidity, Bitcoin entered the first full trading week of January with noticeably increased volatility. Price action continued to respect key technical levels established late December, with BTC struggling to reclaim higher value areas while still finding demand on deeper pullbacks.
This week was largely driven by short-term positioning ahead of key US macro data, with traders clearly cautious into inflation and labour market releases. Structurally, Bitcoin remains in a corrective phase on higher timeframes, while the lower timeframes continue to offer short-term opportunities around well-defined ranges.
Hourly Timeframe Analysis
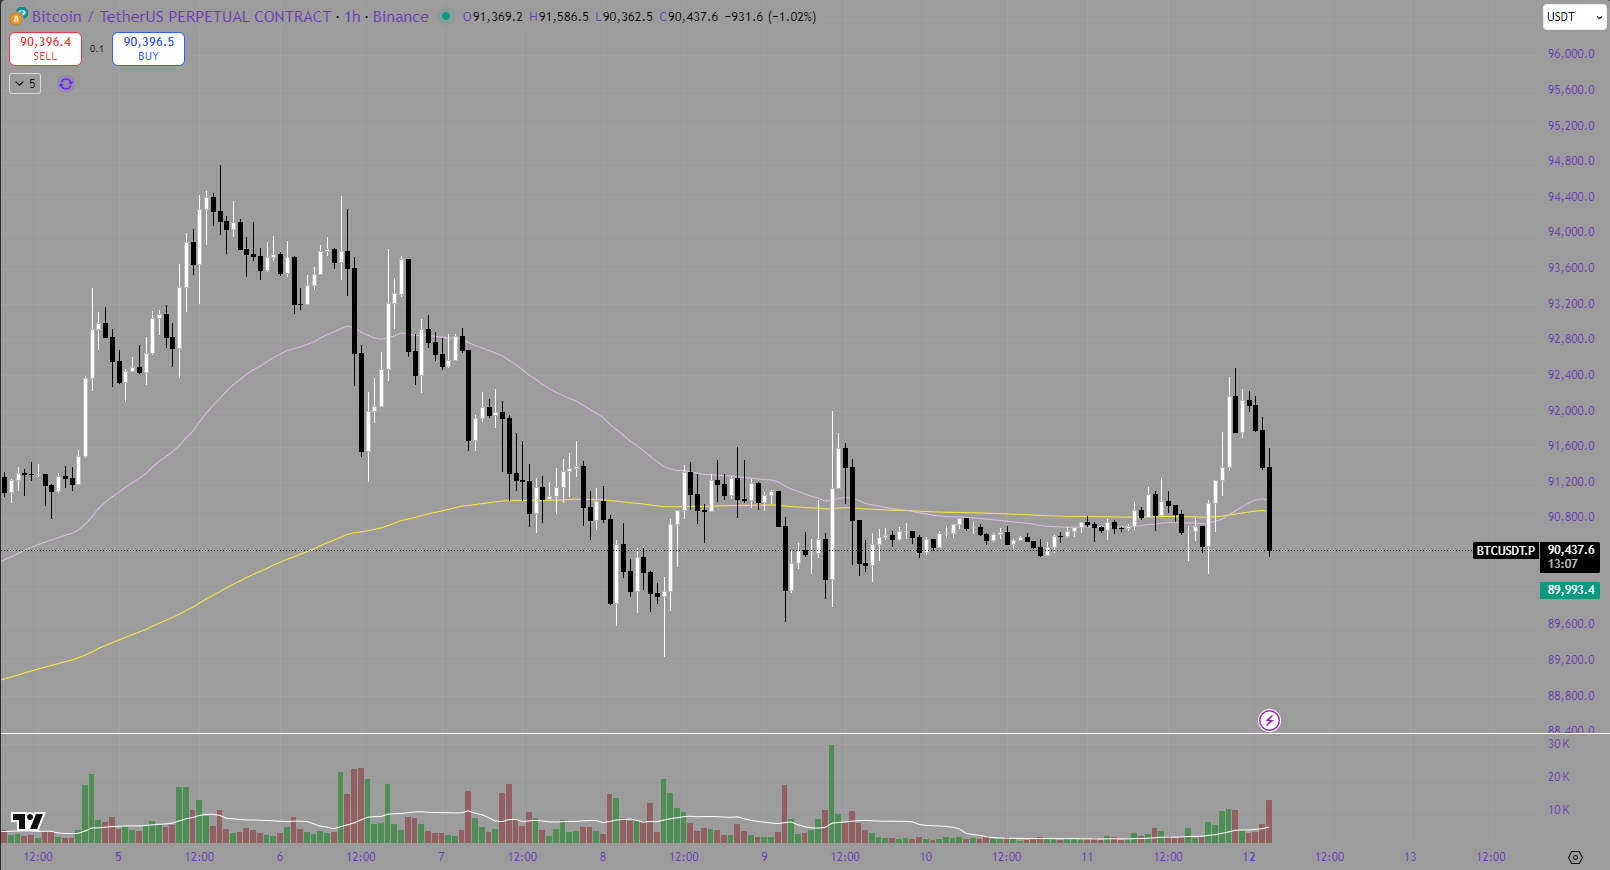
On the hourly chart, Bitcoin spent most of the week rotating around the $90,000 region, which acted as a pivotal intraday equilibrium.
Early in the week, price attempted multiple pushes above local resistance but failed to build acceptance, leading to sharp pullbacks that were quickly met with buyers. These reactions suggest strong short-term participation but limited follow-through, typical of a market waiting on macro confirmation.
Key observations on the hourly:
$90,000 continued to act as a magnet price and short-term decision point
Repeated failures above resistance resulted in fast downside moves, followed by equally fast recoveries
Moving averages flattened, reinforcing a range-bound, rotational environment
Volume spikes were largely reactionary, rather than trend-confirming
As the week progressed, volatility compressed slightly, with price settling back below resistance and holding above prior intraday lows. This behaviour reinforces the idea that Bitcoin is coiling for a larger directional move rather than trending aggressively in either direction.
Daily Timeframe Analysis
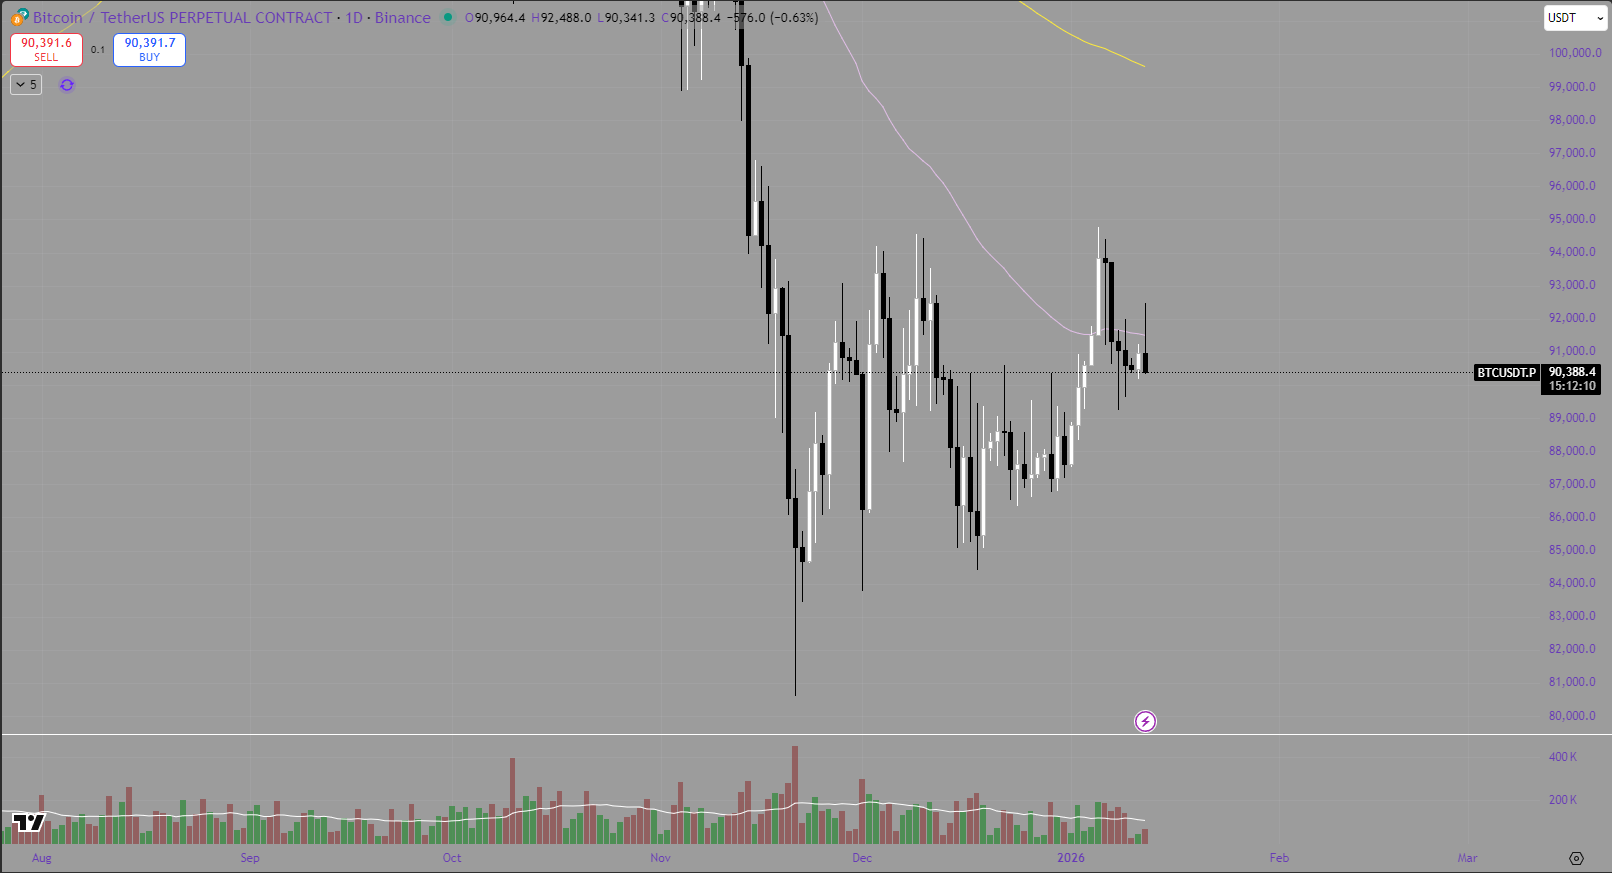
From a daily perspective, Bitcoin remains structurally corrective following the sharp sell-off seen in November. While price has managed to stabilise, it is still trading below key dynamic resistance levels.
The daily chart shows:
A clear rejection from higher levels earlier in the move
Price continuing to trade below declining moving averages
Higher lows forming short-term, but without a confirmed trend reversal
Despite the recent bounce, Bitcoin has yet to convincingly reclaim the daily resistance zone, keeping the broader bias cautious. Buyers are present, but conviction remains limited until stronger acceptance above resistance occurs.
For now, the daily structure suggests range-to-corrective conditions, with any upside moves needing confirmation through sustained closes and volume expansion.
Weekly Outlook & Key Events
From a macro perspective, this week brings several high-impact US economic releases, which traders should be mindful of as potential volatility catalysts.
Key red-flag events from the Crypto Craft calendar include:
US Core CPI (m/m, y/y) – a major driver of risk sentiment and rate expectations
US PPI (m/m) – closely watched for inflationary pressures at the producer level
US Retail Sales – offering insight into consumer strength
US Unemployment Claims – a key labour market indicator
With inflation and employment data back in focus, Bitcoin’s price action is likely to remain sensitive to any surprises that shift expectations around monetary policy.
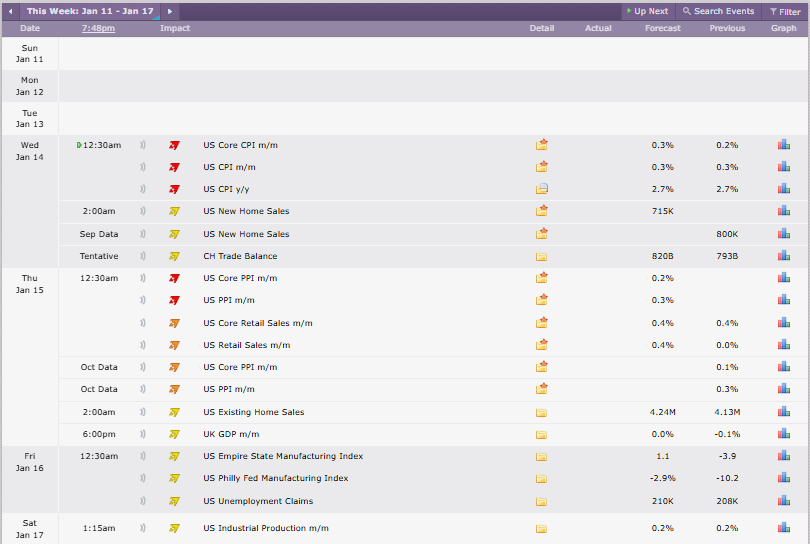
Credit: Crypto Craft
Summary
Bitcoin spent the week consolidating within a well-defined range, respecting key intraday levels while remaining corrective on higher timeframes. The hourly chart highlighted clear rotational behaviour around $90,000, while the daily chart continues to show price capped beneath broader resistance.
As the market moves deeper into January, attention will increasingly shift toward macro confirmation. Until then, patience remains key, with traders best served by respecting range boundaries and managing risk carefully around high-impact news.
As always, let the market show its hand before committing heavily — volatility is back on the table.